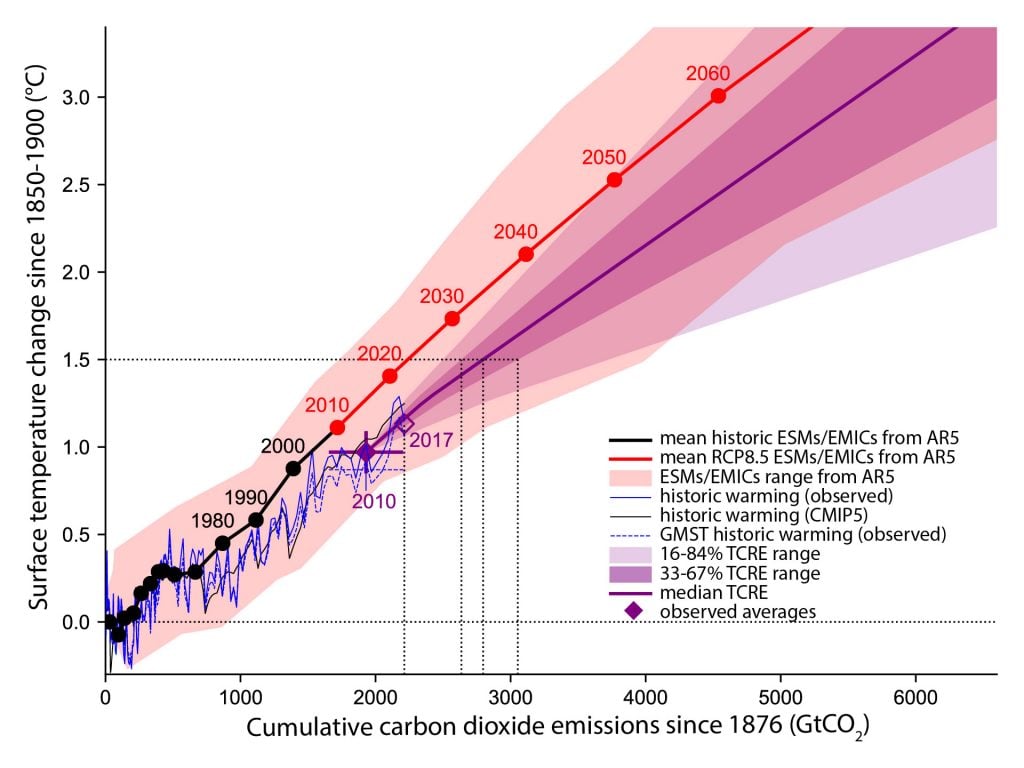
Figure 2.3
Temperature changes from 1850–1900 versus cumulative CO2 emissions since 1st January 1876.
Solid lines with dots reproduce the globally averaged near-surface air temperature response to cumulative CO2 emissions plus non-CO2 forcers as assessed in Figure SPM10 of WGI AR5, except that points marked with years relate to a particular year, unlike in WGI AR5 Figure SPM.10, where each point relates to the mean over the previous decade. The AR5 data was derived from 15 Earth system models and 5 Earth system models of Intermediate Complexity for the historic observations (black) and RCP8.5 scenario (red), and the red shaded plume shows the range across the models as presented in the AR5. The purple shaded plume and the line are indicative of the temperature response to cumulative CO2 emissions and non-CO2 warming adopted in this report. The non-CO2 warming contribution is averaged from the MAGICC and FAIR models, and the purple shaded range assumes the AR5 WGI TCRE distribution (Supplementary Material 2.SM.1.1.2). The 2010 observation of surface temperature change (0.97°C based on 2006–2015 mean compared to 1850–1900, Chapter 1, Section 1.2.1) and cumulative carbon dioxide emissions from 1876 to the end of 2010 of 1,930 GtCO2 (Le Quéré et al., 2018) is shown as a filled purple diamond. The value for 2017 based on the latest cumulative carbon emissions up to the end of 2017 of 2,220 GtCO2 (Version 1.3 accessed 22 May 2018) and a surface temperature anomaly of 1.1°C based on an assumed temperature increase of 0.2°C per decade is shown as a hollow purple diamond. The thin blue line shows annual observations, with CO2 emissions from Le Quéré et al. (2018) and estimated globally averaged near-surface temperature from scaling the incomplete coverage and blended HadCRUT4 dataset in Chapter 1. The thin black line shows the CMIP5 multimodel mean estimate with CO2 emissions also from (Le Quéré et al., 2018). The thin black line shows the GMST historic temperature trends from Chapter 1, which give lower temperature changes up to 2006–2015 of 0.87°C and would lead to a larger remaining carbon budget. The dotted black lines illustrate the remaining carbon budget estimates for 1.5°C given in Table 2.2. Note these remaining budgets exclude possible Earth system feedbacks that could reduce the budget, such as CO2 and CH4 release from permafrost thawing and tropical wetlands (see Section 2.2.2.2).