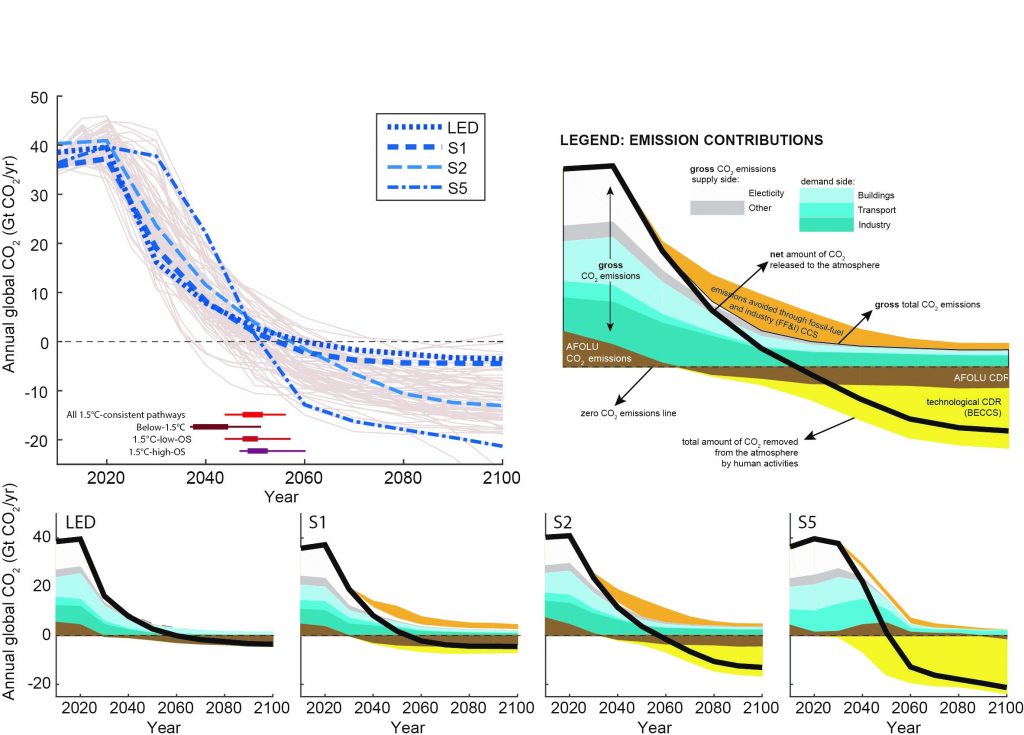
The top-left panel shows global net CO2 emissions in Below-1.5°C, 1.5°C-low-overshoot (OS), and 1.5°C-high-OS pathways, with the four illustrative 1.5°C-consistent pathway archetypes of this chapter highlighted. Ranges at the bottom of the top-left panel show the 10th–90th percentile range (thin line) and interquartile range (thick line) of the time that global CO2 emissions reach net zero per pathway class, and for all pathways classes combined. The top-right panel provides a schematic legend explaining all CO2 emissions contributions to global CO2 emissions. The bottom row shows how various CO2 contributions are deployed and used in the four illustrative pathway archetypes (LED, S1, S2, S5, referred to as P1, P2, P3, and P4 in the Summary for Policymakers) used in this chapter (see Section 2.3.1.1). Note that the S5 scenario reports the building and industry sector emissions jointly. Green-blue areas hence show emissions from the transport sector and the joint building and industry demand sector, respectively.