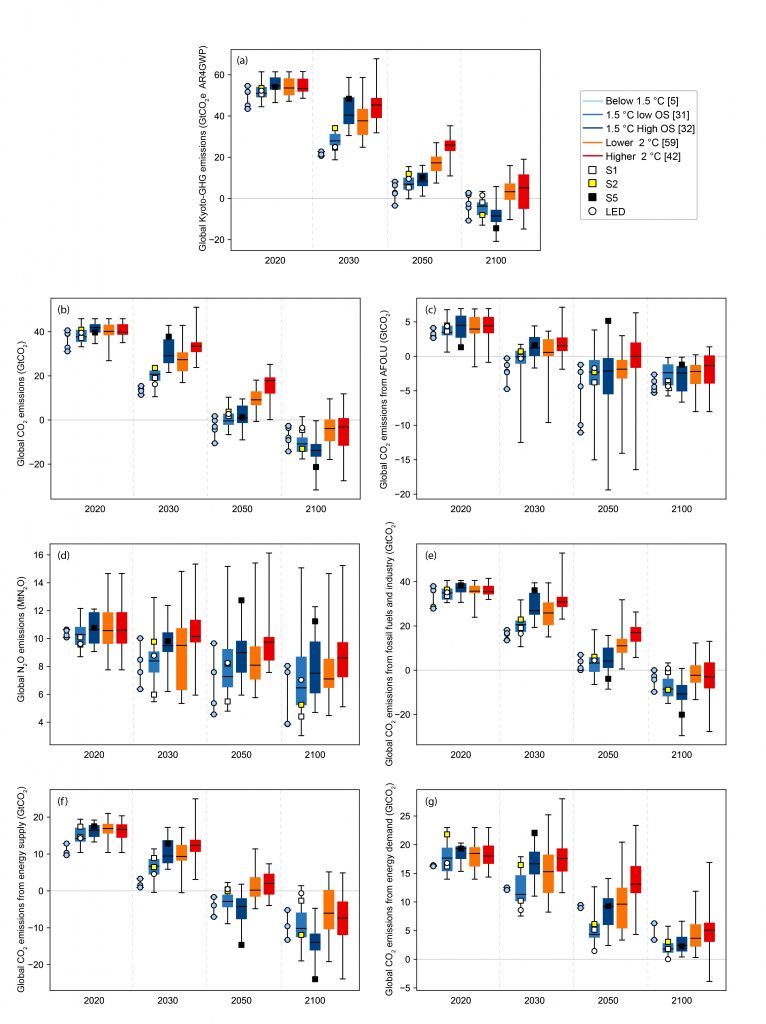
Annual global emissions characteristics for 2020, 2030, 2050, 2100.
Data are shown for (a) Kyoto-GHG emissions, and (b) global total CO2 emissions, (c) CO2 emissions from the agriculture, forestry and other land use (AFOLU) sector, (d) global N2O emissions, and (e) CO2 emissions from fossil fuel use and industrial processes. The latter is also split into (f) emissions from the energy supply sector (electricity sector and refineries) and (g) direct emissions from fossil-fuel use in energy demand sectors (industry, buildings, transport) (bottom row). Horizontal black lines show the median, boxes show the interquartile range, and whiskers the minimum–maximum range. Icons indicate the four pathway archetypes used in this chapter. In case less than seven data points are available in a class, the minimum–maximum range and single data points are shown. Kyoto-GHG, emissions in the top panel are aggregated with AR4 GWP-100 and contain CO2, CH4, N2O, HFCs, PFCs, and SF6. NF3 is typically not reported by IAMs. Scenarios with year-2010 Kyoto-GHG emissions outside the range assessed by IPCC AR5 WGIII assessed are excluded (IPCC, 2014b).