Figure 2.7

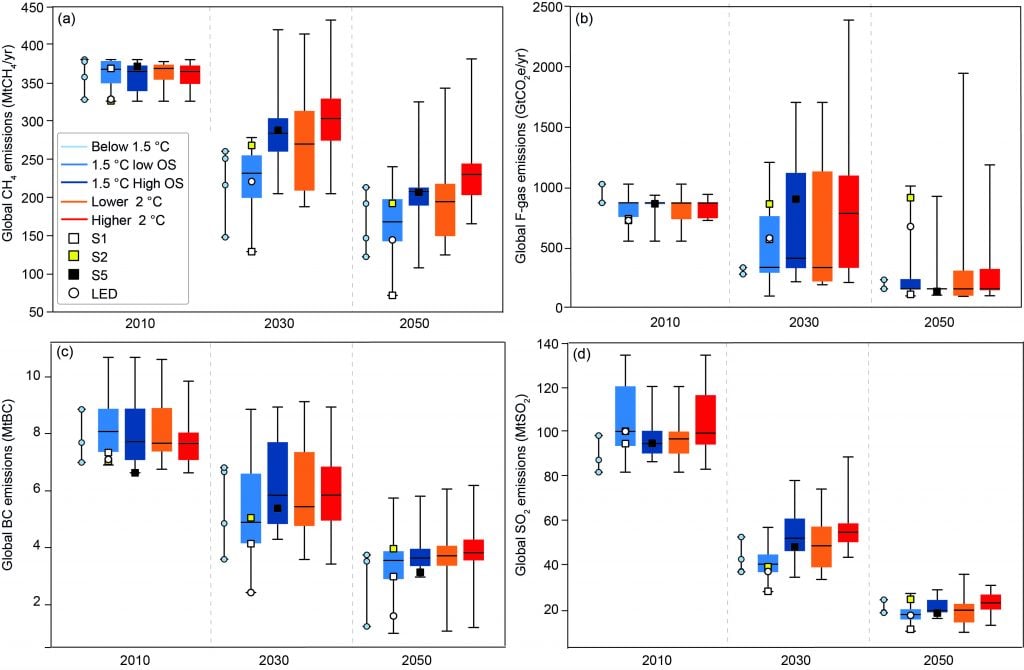
Global characteristics of a selection of short-lived non-COemissions until mid-century for five pathway classes used in this chapter.

Data are shown for (a) methane (CH4), (b) fluorinated gases (F-gas), (c) black carbon (BC), and (d) sulphur dioxide (SO2) emissions. Boxes with different colours refer to different scenario classes. Icons on top the ranges show four illustrative pathway archetypes that apply different mitigation strategies for limiting warming to 1.5°C. Boxes show the interquartile range, horizontal black lines the median, and whiskers the minimum–maximum range. F-gases are expressed in units of CO2-equivalence computed with 100-year Global Warming Potentials reported in IPCC AR4.

Original Creation for this Report using IAMC 1.5°C Scenario Data hosted by IIASA