Figure 2.10
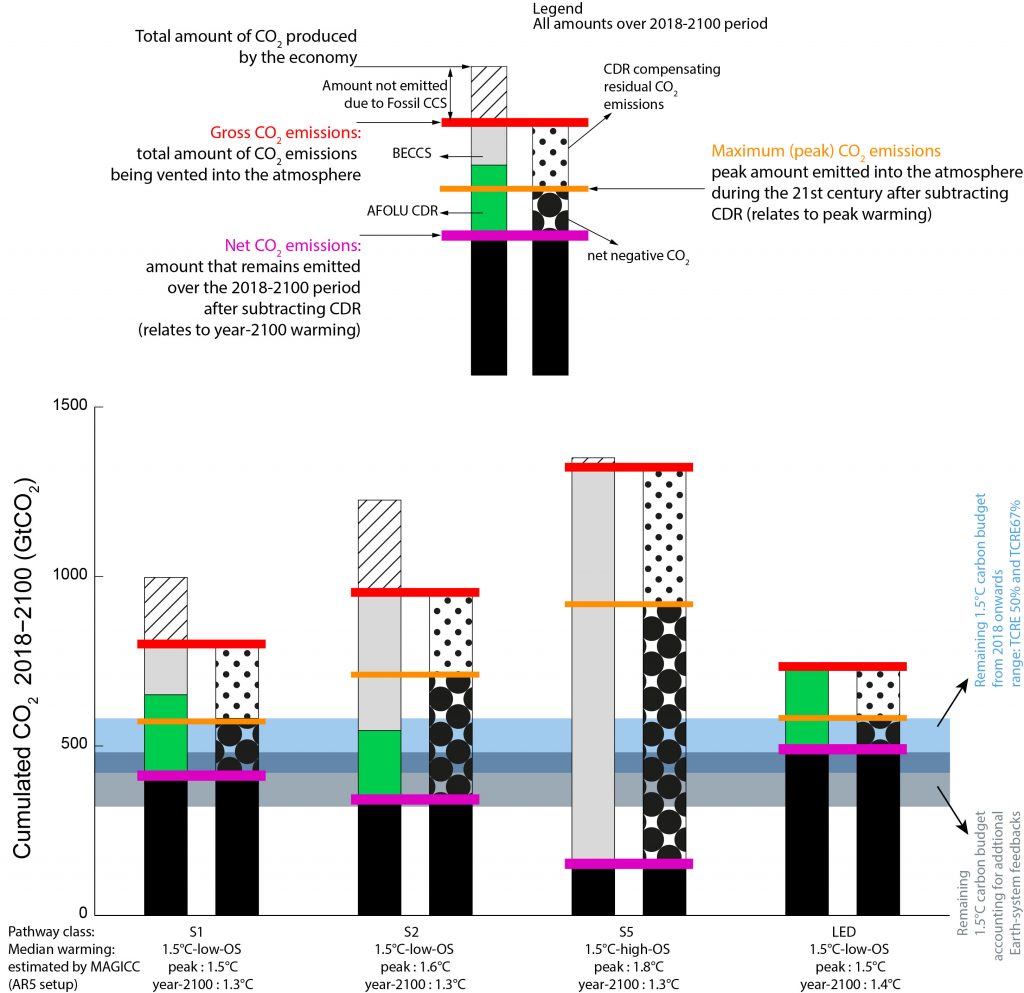
Accounting of cumulative CO2 emissions for the four 1.5°C-consistent pathway archetypes.

Accounting of cumulative CO2 emissions for the four 1.5°C-consistent pathway archetypes.
See top panel for explanation of the bar plots. Total CDR is the difference between gross (red horizontal bar) and net (purple horizontal bar) cumulative CO2 emissions over the period 2018–2100, and it is equal to the sum of the BECCS (grey) and AFOLU CDR (green) contributions. Cumulative net negative emissions are the difference between peak (orange horizontal bar) and net (purple) cumulative CO2 emissions. The blue shaded area depicts the estimated range of the remaining carbon budget for a two-in-three to one-in-two chance of staying below1.5°C. The grey shaded area depicts the range when accounting for additional Earth system feedbacks.
Original Creation for this Report using IAMC 1.5°C Scenario Data hosted by IIASA