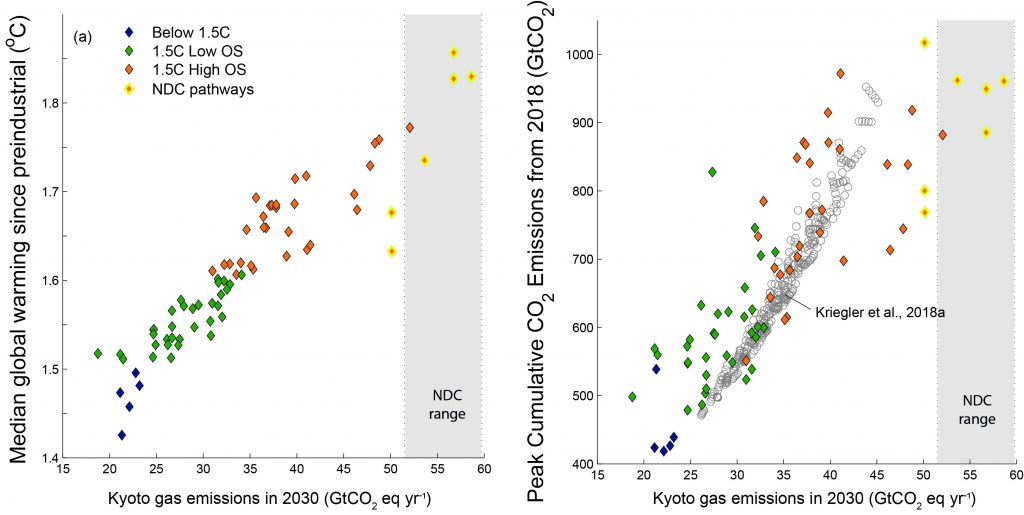
Pathways that were forced to go through the NDCs or a similarly high emissions point in 2030 by design are highlighted by yellow marker edges (see caption of Figure 2.13 and text for further details on the design of these pathways). The combined range of global Kyoto-GHG emissions in 2030 for the conditional and unconditional NDCs assessed in Cross-Chapter Box 11 is shown by the grey shaded area (adjusted to AR4 GWPs for comparison). As a second line of evidence, peak cumulative CO2 emissions derived from a 1.5°C pathway sensitivity analysis (Kriegler et al., 2018b) are shown by grey circles in the right-hand panel. Circles show gross fossil-fuel and industry emissions of the sensitivity cases, increased by assumptions about the contributions from AFOLU (5 GtCO2 yr−1 until 2020, followed by a linear phase out until 2040) and non-CO2 Kyoto-GHGs (median non-CO2 contribution from 1.5°C-consistent pathways available in the database: 10 GtCO2e yr−1 in 2030), and reduced by assumptions about CDR deployment until the time of net zero CO2 emissions (limiting case for CDR deployment assumed in (Kriegler et al., 2018b) (logistic growth to 1, 4, 10 GtCO2 yr−1 in 2030, 2040, and 2050, respectively, leading to approximately 100 GtCO2 of CDR by mid-century).