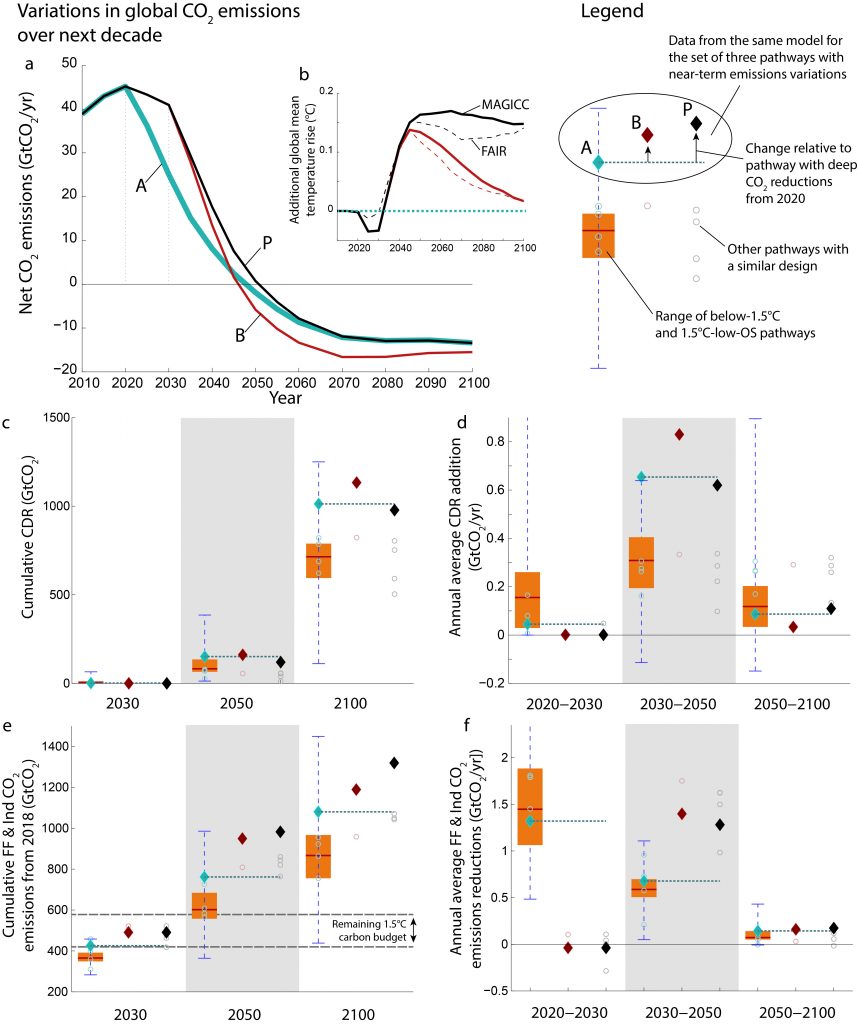
Comparison of 1.5°C-consistent pathways starting action as of 2020 (A; light-blue diamonds) with pathways following the NDCs until 2030 and aiming to limit warming to 1.5°C thereafter.
The 1.5°C pathways that follow the NDCs until 2030 either aim for the same cumulative CO2 emissions by 2100 as the pathways that start action as of 2020 (B; red diamonds) or assume the same mitigation stringency as reflected by the price of emissions in associated least-cost 1.5°C-consistent pathways starting from 2020 (P; black diamonds). Panels show (a) the underlying emissions pathways, (b) additional warming in the delay scenarios compared to 2020 action case, (c) cumulated CDR, (d) CDR ramp-up rates, (e) cumulated gross CO2 emissions from fossil-fuel combustion and industrial (FFI) processes over the 2018–2100 period, and (f) gross FFI CO2 emissions reductions rates. Scenario pairs or triplets (circles and diamonds) with 2020 and 2030 action variants were calculated by six (out of seven) models in the ADVANCE study symbols (Luderer et al., 2018) and five of them (passing near-term plausibility checks) are shown by symbols. Only two of five models could identify pathways with post-2030 action leading to a 2016–2100 carbon budget of about 200 GtCO2 (red). The range of all 1.5°C pathways with no and low overshoot is shown by the boxplots.