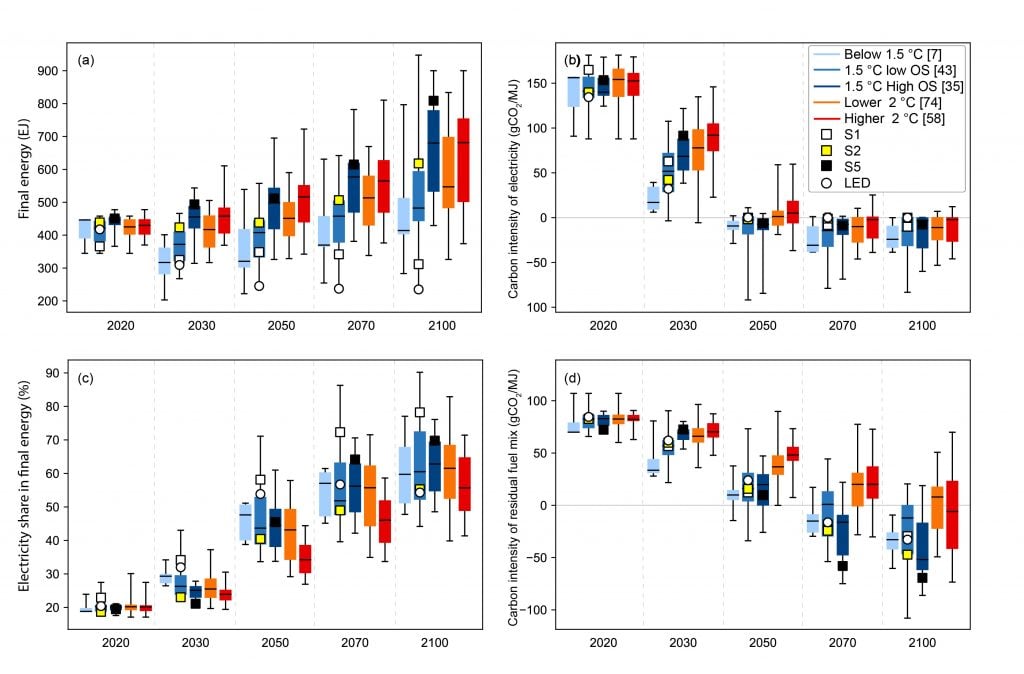
Figure 2.14
Decomposition of transformation pathways into (a) energy demand, (b) carbon intensity of electricity, (c) the electricity share in final energy, and (d) the carbon intensity of the residual (non-electricity) fuel mix

Decomposition of transformation pathways into (a) energy demand, (b) carbon intensity of electricity, (c) the electricity share in final energy, and (d) the carbon intensity of the residual (non-electricity) fuel mix
Box plots show median, interquartile range and full range of pathways. Pathway temperature classes (Table 2.1) and illustrative pathway archetypes are indicated in the legend. Values following the class labels give the number of available pathways in each class.
Original Creation for this Report using IAMC 1.5°C Scenario Data hosted by IIASA