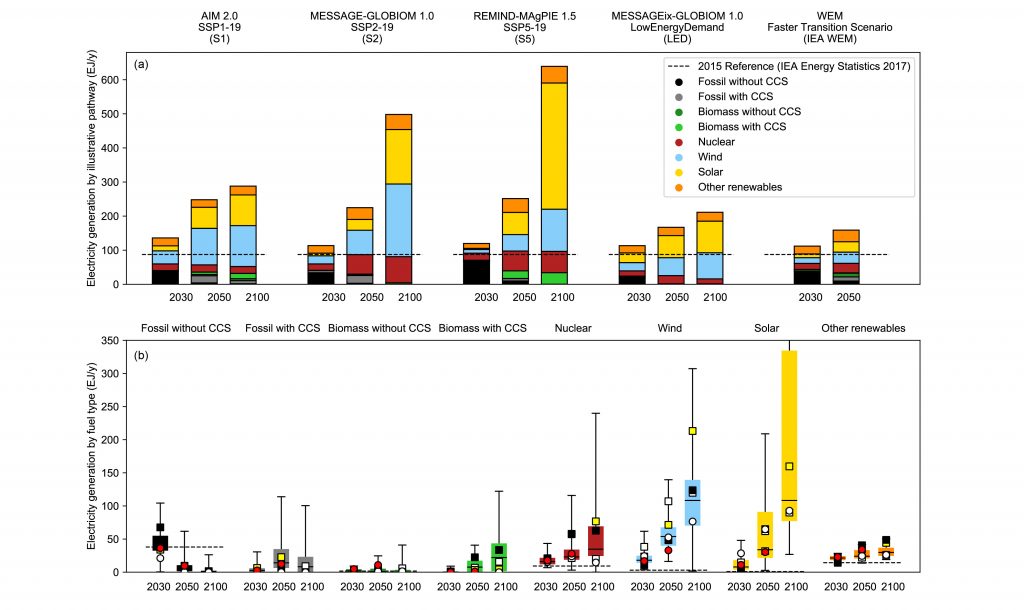
Electricity generation for the four illustrative pathway archetypes plus the IEA’s Faster Transition Scenario (OECD/IEA and IRENA, 2017)375 (panel a), and their relative location in the ranges for pathways limiting warming to 1.5°C with no or limited overshoot (panel b).
The category ‘Other renewables’ includes electricity generation not covered by the other categories, for example, hydro and geothermal. The number of pathways that have higher primary energy than the scale in the bottom panel are indicated by the numbers above the whiskers. Black horizontal dashed lines indicate the level of primary energy supply in 2015 (IEA, 2017e). Box plots in the lower panel show the minimum–maximum range (whiskers), interquartile range (box), and median (vertical thin black line). Symbols in the lower panel show the four pathway archetypes – S1 (white square), S2 (yellow square), S5 (black square), LED (white disc) – as well as the IEA’s Faster Transition Scenario (red disc). Pathways with no or limited overshoot included the Below-1.5°C and 1.5°C-low-OS classes.