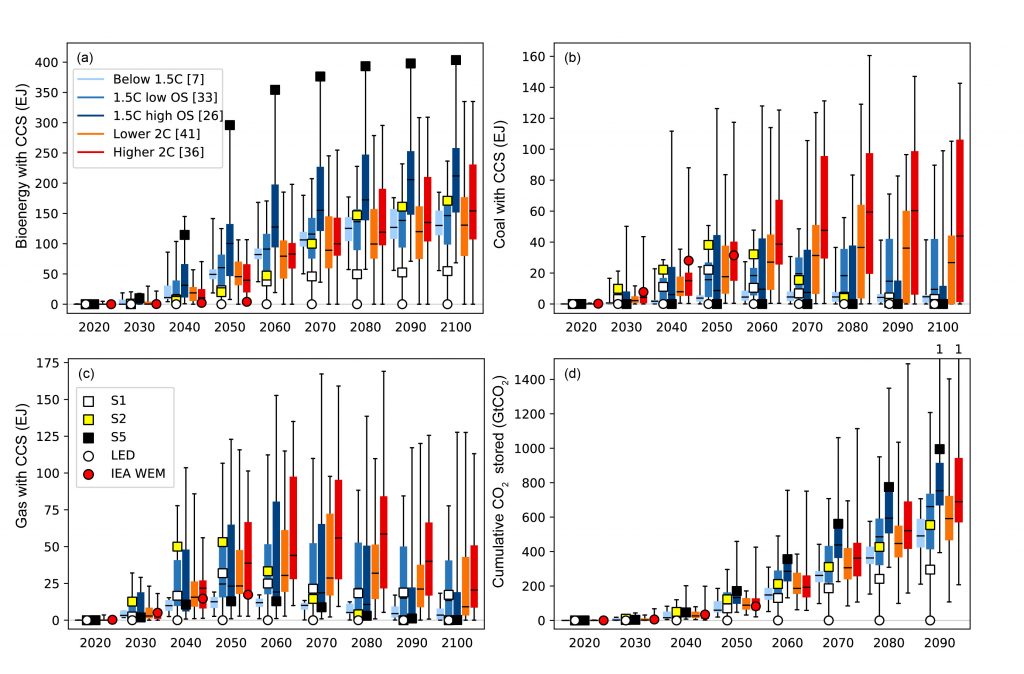
CCS deployment in 1.5°C and 2°C pathways for (a) biomass, (b) coal and (c) natural gas (EJ of primary energy) and (d) the cumulative quantity of fossil (including from, e.g., cement production) and biomass CO2 stored via CCS (in GtCO2 stored).
TBox plots show median, interquartile range and full range of pathways in each temperature class. Pathway temperature classes (Table 2.1), illustrative pathway archetypes, and the IEA’s Faster Transition Scenario (IEA WEM) (OECD/IEA and IRENA, 2017) are indicated in the legend.