Figure 2.22
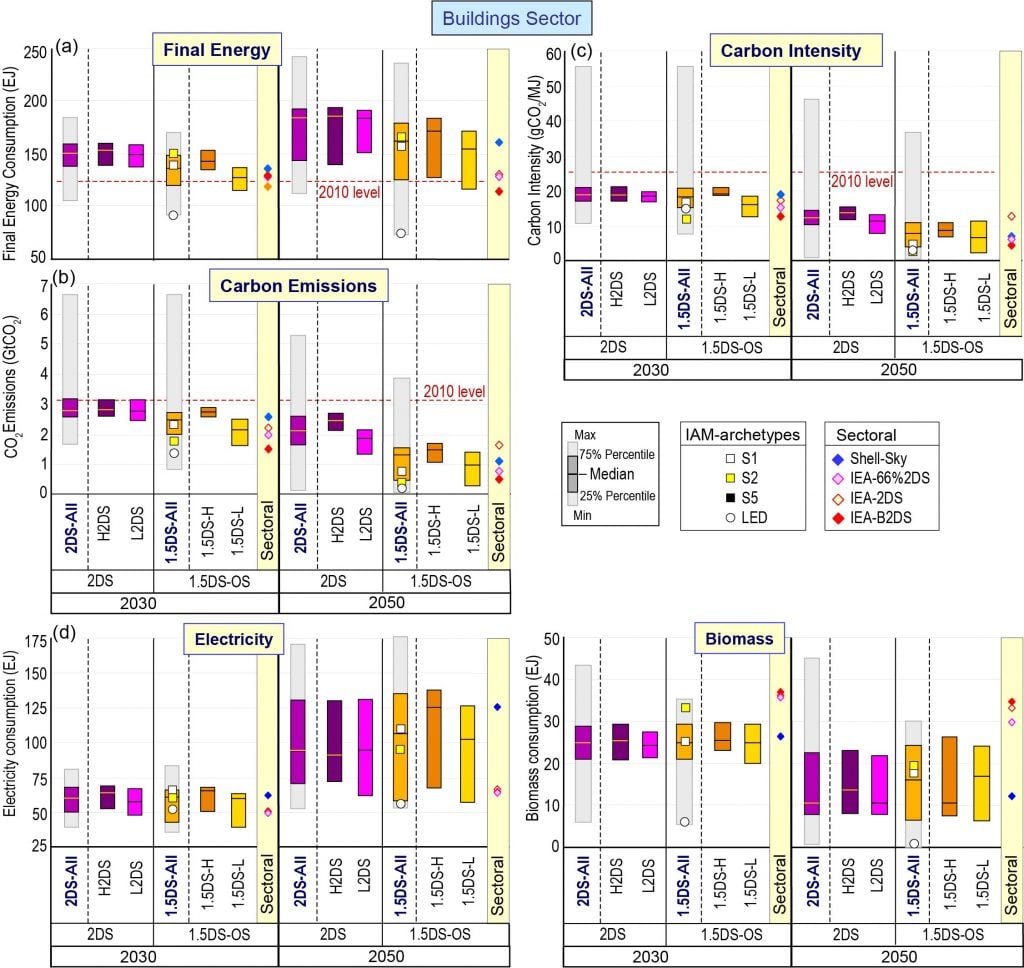
Comparison of (a) final energy, (b) direct CO2 emissions, (c) carbon intensity, (d) electricity and biomass consumption in the buildings sector between IAM and sectoral studies.
Comparison of (a) final energy, (b) direct CO2 emissions, (c) carbon intensity, (d) electricity and biomass consumption in the buildings sector between IAM and sectoral studies.
Original Creation for this Report using IAMC 1.5°C Scenario Data hosted by IIASA