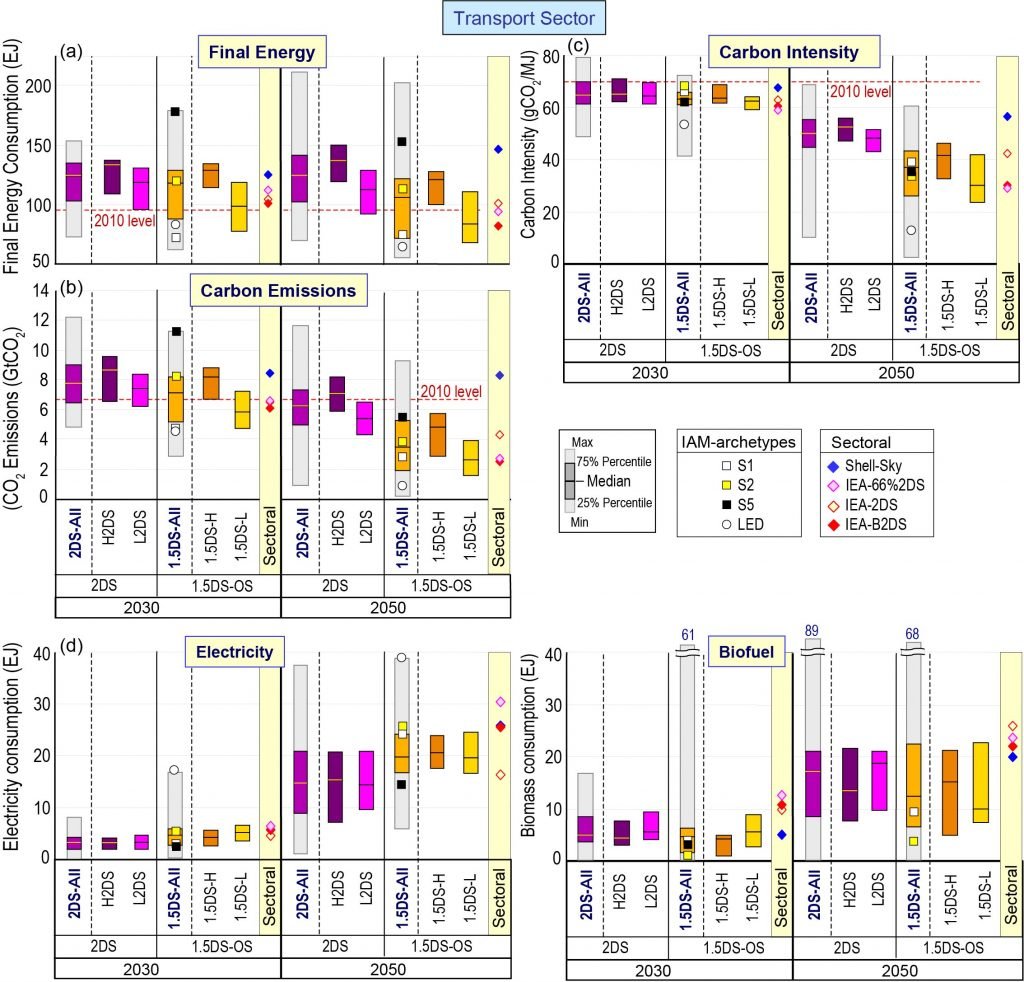
Figure 2.23
Comparison of (a) final energy, (b) direct CO2 emissions, (c) carbon intensity, (d) electricity and biofuel consumption in the transport sector between IAM and sectoral studies.

Comparison of (a) final energy, (b) direct CO2 emissions, (c) carbon intensity, (d) electricity and biofuel consumption in the transport sector between IAM and sectoral studies.
The squares and circles indicate the IAM archetype pathways and diamonds the data of sectoral scenarios. The red dotted line indicates the 2010 level. H2DS = Higher-2°C, L2DS = Lower-2°C, 1.5DS-H = 1.5°C-high-OS, 1.5DS-L = 1.5°C-low-OS. The label 1.5DS combines both high and low overshoot 1.5°C-consistent pathways. Section 2.1 for descriptions.
Original Creation for this Report using IAMC 1.5°C Scenario Data hosted by IIASA