Figure 2.19
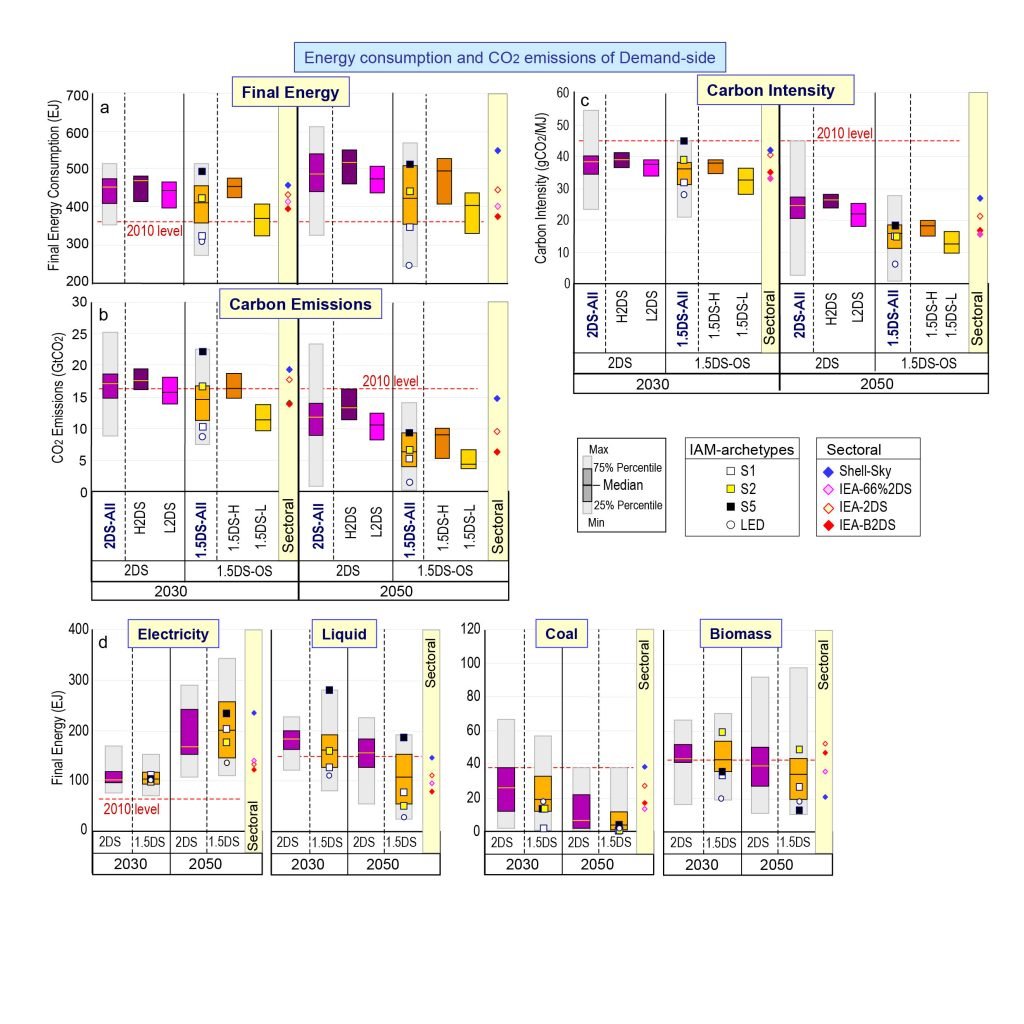
(a) Global final energy, (b) direct CO2 emissions from the all energy demand sectors, (c) carbon intensity, and (d) structure of final energy (electricity, liquid fuel, coal, and biomass).
(a) Global final energy, (b) direct CO2 emissions from the all energy demand sectors, (c) carbon intensity, and (d) structure of final energy (electricity, liquid fuel, coal, and biomass).
Original Creation for this Report using IAMC 1.5°C Scenario Data hosted by IIASA