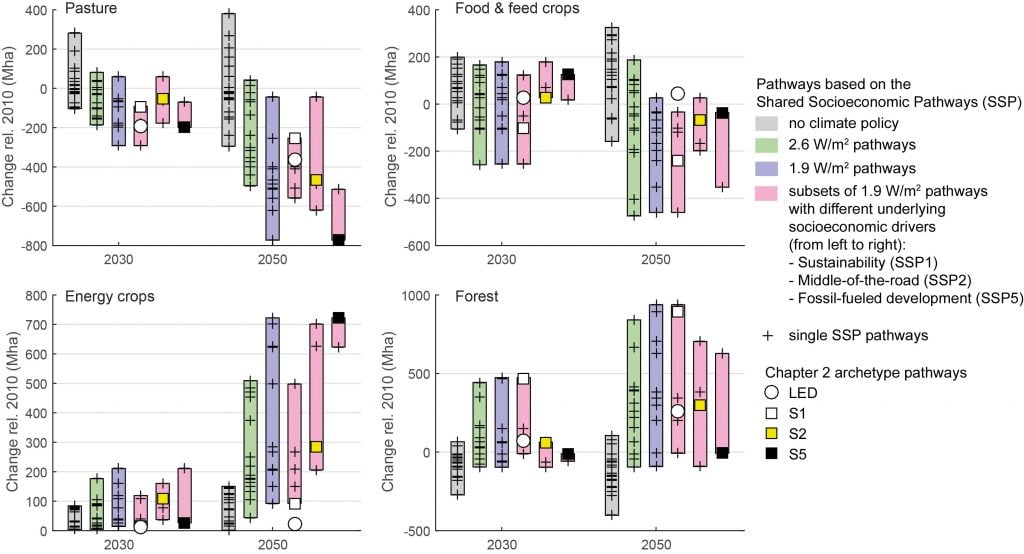
Overview of land-use change transitions in 2030 and 2050, relative to 2010 based on pathways based on the Shared Socio-Economic Pathways (SSPs) (Popp et al., 2017; Riahi et al., 2017; Rogelj et al., 2018)441.
Grey: no-climate-policy baseline; green: 2.6 W m−2 pathways; blue: 1.9 W m−2 pathways. Pink: 1.9 W m−2 pathways grouped per underlying socio-economic assumption (from left to right: SSP1 sustainability, SSP2 middle-of-the-road, SSP5 fossil-fuelled development). Ranges show the minimum–maximum range across the SSPs. Single pathways are shown with plus signs. Illustrative archetype pathways are highlighted with distinct icons. Each panel shows the changes for a different land type. The 1.9 and 2.6 W m−2 pathways are taken as proxies for 1.5°C and 2°C pathways, respectively. The 2.6 W m−2 pathways are mostly consistent with the Lower-2°C and Higher-2°C pathway classes. The 1.9 W m−2 pathways are consistent with the 1.5°C-low-OS (mostly SSP1 and SSP2) and 1.5°C-high-OS (SSP5) pathway classes. In 2010, pasture was estimated to cover about 3–3.5 103 Mha, food and feed crops about 1.5–1.6 103 Mha, energy crops about 0–14 Mha and forest about 3.7–4.2 103 Mha, across the models that reported SSP pathways (Popp et al., 2017). When considering pathways limiting warming to 1.5°C with no or limited overshoot, the full set of scenarios shows a conversion of 50–1100 Mha of pasture into 0–600 Mha for energy crops, a 200 Mha reduction to 950 Mha increase forest, and a 400 Mha decrease to a 250 Mha increase in non-pasture agricultural land for food and feed crops by 2050 relative to 2010. The large range across the literature and the understanding of the variations across models and assumptions leads to medium confidence in the size of these ranges.