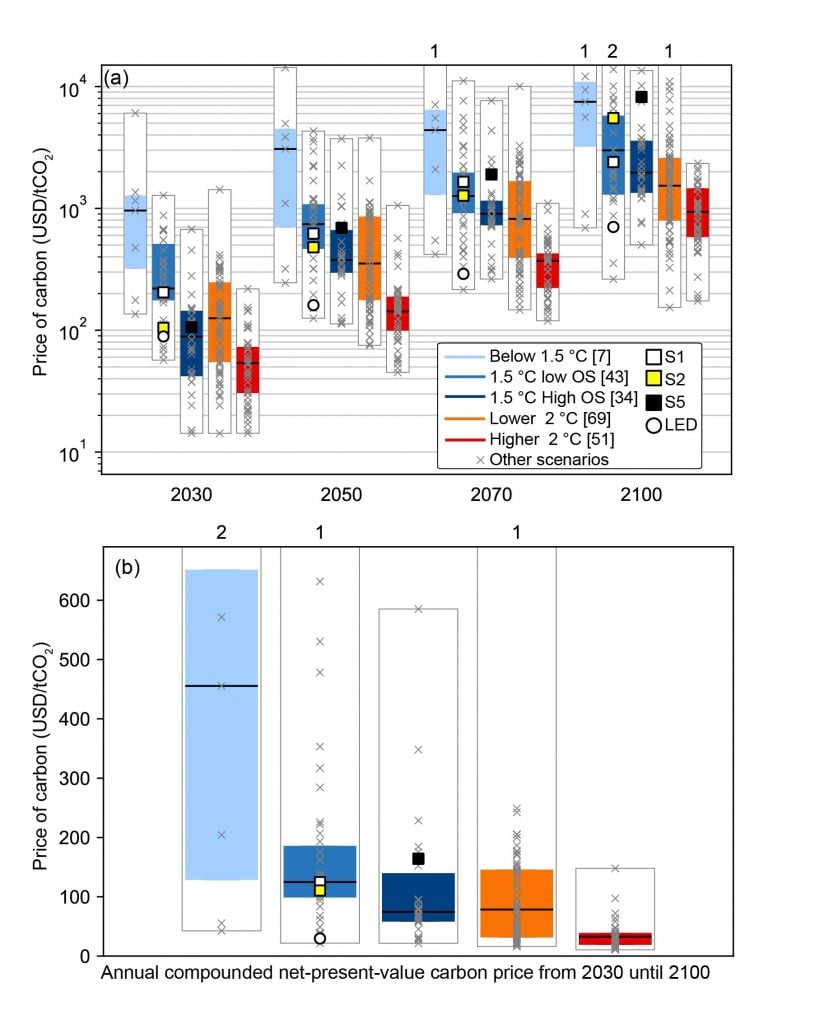
Global price of carbon emissions consistent with mitigation pathways.
Panels show (a) undiscounted price of carbon (2030–2100) and (b) average price of carbon (2030–2100) discounted at a 5% discount rate to 2020 in USD2010. AC: Annually compounded. NPV: Net present value. Median values in floating black line. The number of pathways included in box plots is indicated in the legend. Number of pathways outside the figure range is noted at the top.