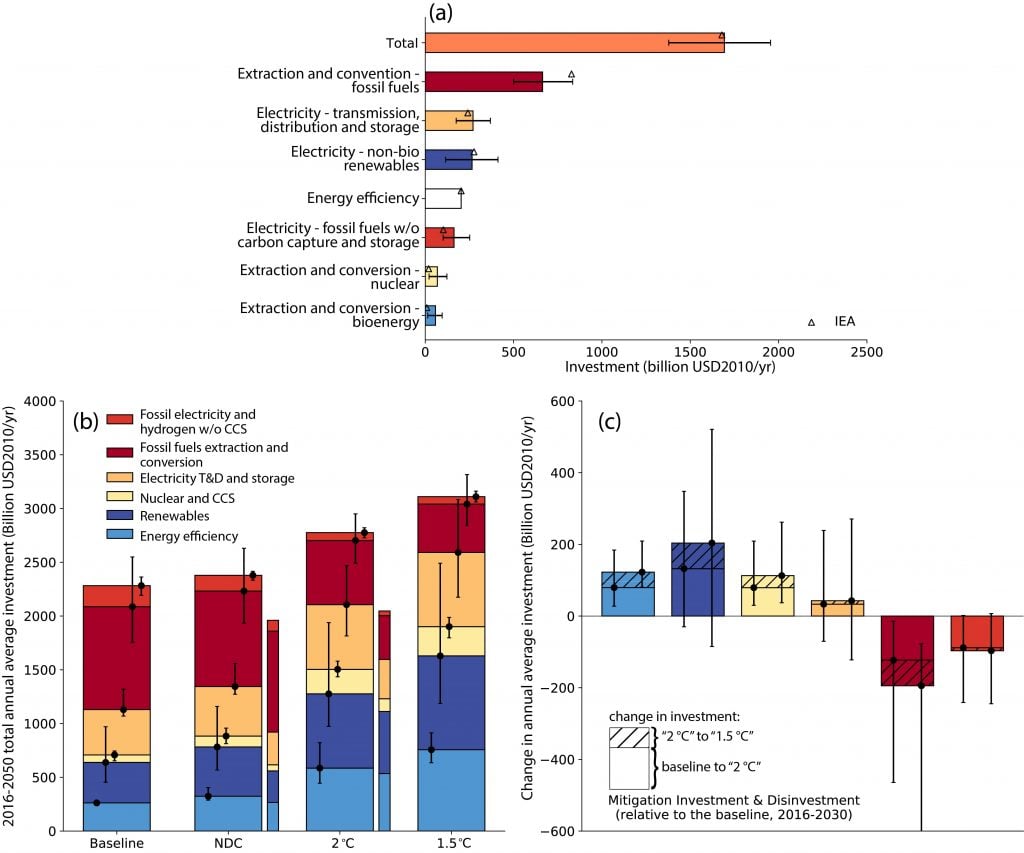
Figure 2.27
Historical and projected global energy investments.
(a) Historical investment estimates across six global models from (McCollum et al., 2018) (bars = model means, whiskers full model range) compared to historical estimates from IEA (International Energy Agency (IEA) 2016) (triangles). (b) Average annual investments over the 2016–2050 period in the “baselines” (i.e., pathways without new climate policies beyond those in place today), scenarios which implement the NDCs (‘NDC’, including conditional NDCs), scenarios consistent with the Lower-2°C pathway class (‘2°C’), and scenarios in line with the 1.5°C-low-OS pathway class (‘1.5°C’). Whiskers show the range of models; wide bars show the multimodel means; narrow bars represent analogous values from individual IEA scenarios (OECD/IEA and IRENA, 2017). (c) Average annual mitigation investments and disinvestments for the 2016–2030 periods relative to the baseline. The solid bars show the values for ‘2°C’ pathways, while the hatched areas show the additional investments for the pathways labelled with ‘1.5°C’. Whiskers show the full range around the multimodel means. T&D stands for transmission and distribution, and CCS stands for carbon capture and storage. Global cumulative carbon dioxide emissions, from fossil fuels and industrial processes (FF&I) but excluding land use, over the 2016-2100 timeframe range from 880 to 1074 GtCO2 (multimodel mean: 952 GtCO2) in the ‘2°C’ pathway and from 206 to 525 GtCO2 (mean: 390 GtCO2) in the ‘1.5°C’ pathway.