Pathways classification overview.
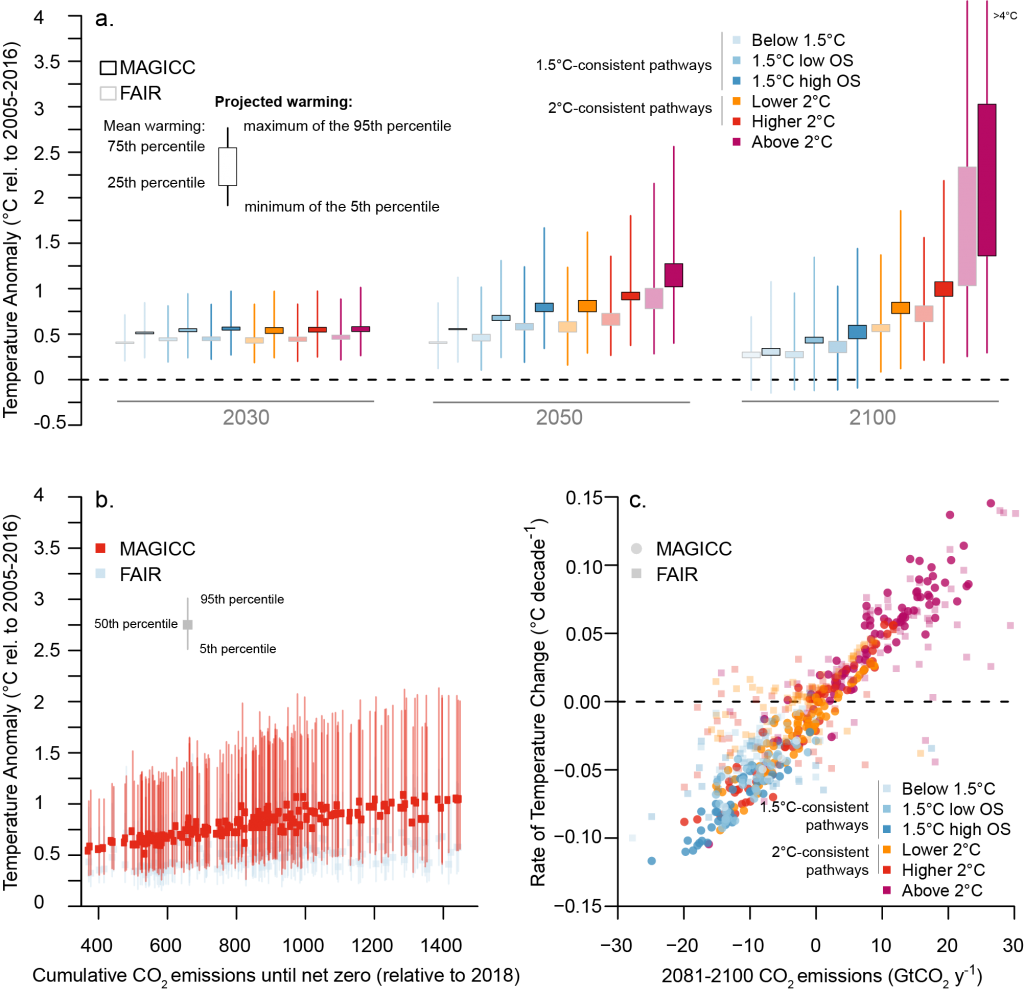
(a) Average global mean temperature increase relative to 2010 as projected by FAIR and MAGICC in 2030, 2050 and 2100; (b) response of peak warming to cumulative CO2 emissions until net zero by MAGICC (red) and FAIR (blue); (c) decadal rate of average global mean temperature change from 2081 to 2100 as a function of the annual CO2 emissions averaged over the same period as given by FAIR (transparent squares) and MAGICC (filled circles). In panel (a), horizontal lines at 0.63°C and 1.13°C are indicative of the 1.5°C and 2°C warming thresholds with the respect to 1850–1900, taking into account the assessed historical warming of 0.87°C ±0.12°C between the 1850–1900 and 2006–2015 periods (Chapter 1, Section 1.2.1). In panel (a), vertical lines illustrate both the physical and the scenario uncertainty as captured by MAGICC and FAIR and show the minimal warming of the 5th percentile of projected warming and the maximal warming of the 95th percentile of projected warming per scenario class. Boxes show the interquartile range of mean warming across scenarios, and thus represent scenario uncertainty only.