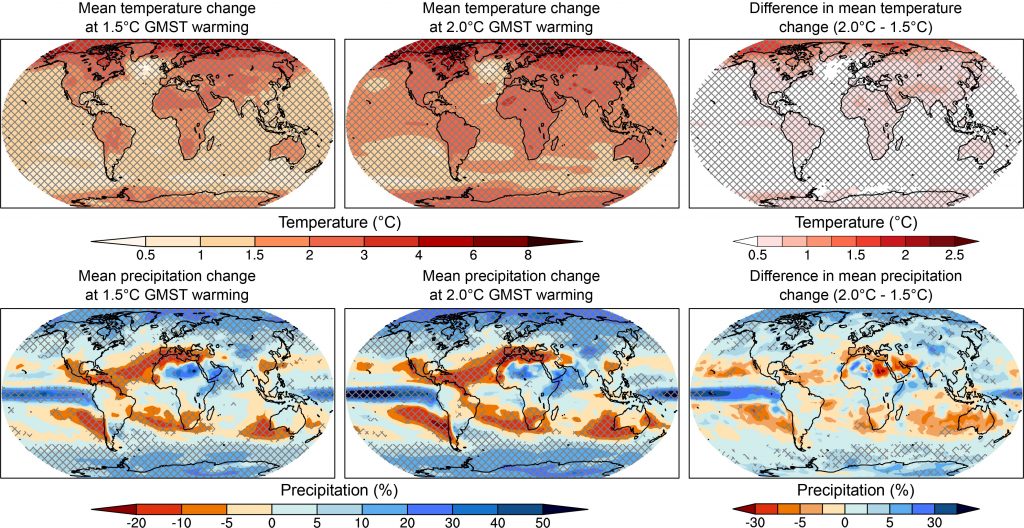
Projected changes in mean temperature (top) and mean precipitation (bottom) at 1.5°C (left) and 2°C (middle) of global warming compared to the pre-industrial period (1861–1880), and the difference between 1.5°C and 2°C of global warming (right).
Cross-hatching highlights areas where at least two-thirds of the models agree on the sign of change as a measure of robustness (18 or more out of 26). Values were assessed from the transient response over a 10-year period at a given warming level, based on Representative Concentration Pathway (RCP)8.5 Coupled Model Intercomparison Project Phase 5 (CMIP5) model simulations (adapted from Seneviratne et al., 2016 and Wartenburger et al., 2017, see Supplementary Material 3.SM.2 for more details). Note that the responses at 1.5°C of global warming are similar for RCP2.6 simulations (see Supplementary Material 3.SM.2). Differences compared to 1°C of global warming are provided in the Supplementary Material 3.SM.2.