Figure 3.7
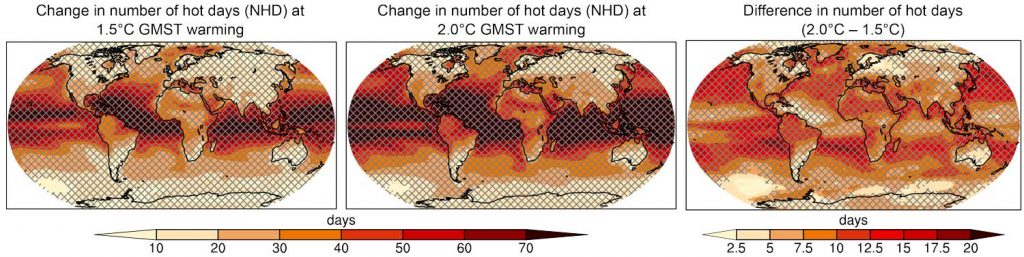
Projected changes in the number of hot days (NHD; 10% warmest days) at 1.5°C (left) and at 2°C (middle) of global warming compared to the pre-industrial period (1861–1880), and the difference between 1.5°C and 2°C of warming (right).
Projected changes in the number of hot days (NHD; 10% warmest days) at 1.5°C (left) and at 2°C (middle) of global warming compared to the pre-industrial period (1861–1880), and the difference between 1.5°C and 2°C of warming (right).
Original Creation for this Report using CMIP5 multi-model ensemble output data.