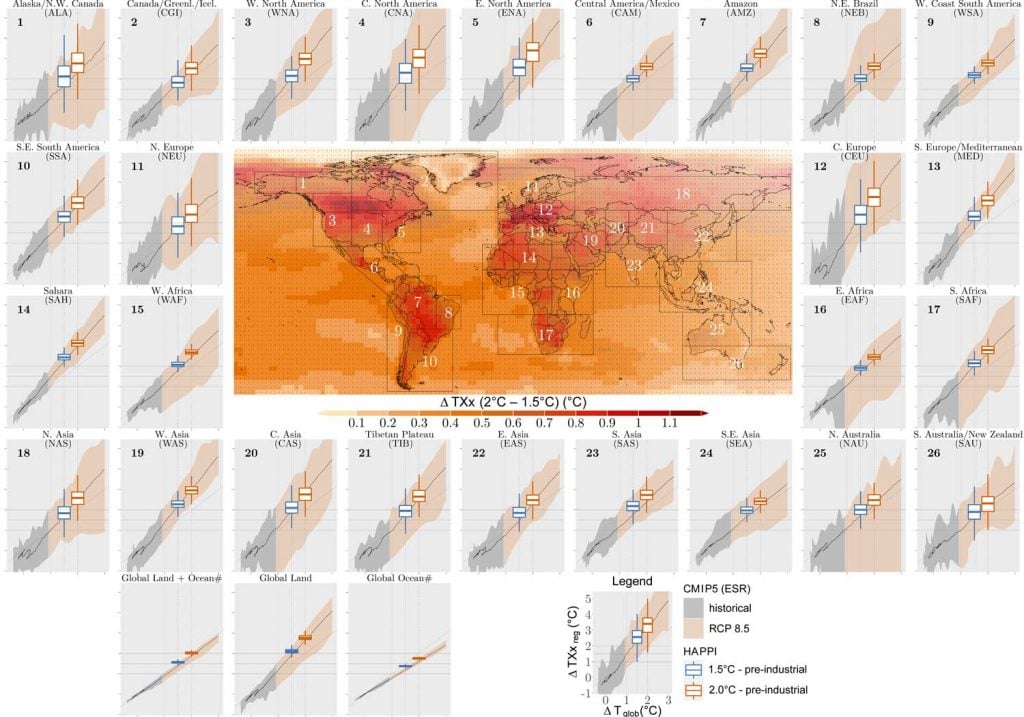
Figure 3.5
Projected changes in annual maximum daytime temperature (TXx) as a function of global warming for IPCC Special Report on Managing the Risk of Extreme Events and Disasters to Advance Climate Change Adaptation (SREX) regions (see Figure 3.2), based on an empirical scaling relationship applied to Coupled Model Intercomparison Project Phase 5 (CMIP5) data (adapted from Seneviratne et al., 201686 and Wartenburger et al., 2017)87 together with projected changes from the Half a degree additional warming, prognosis and projected impacts (HAPPI) multimodel experiment (Mitchell et al., 201788; based on analyses in Seneviratne et al., 2018c)89 (bar plots on regional analyses and central plot, respectively).