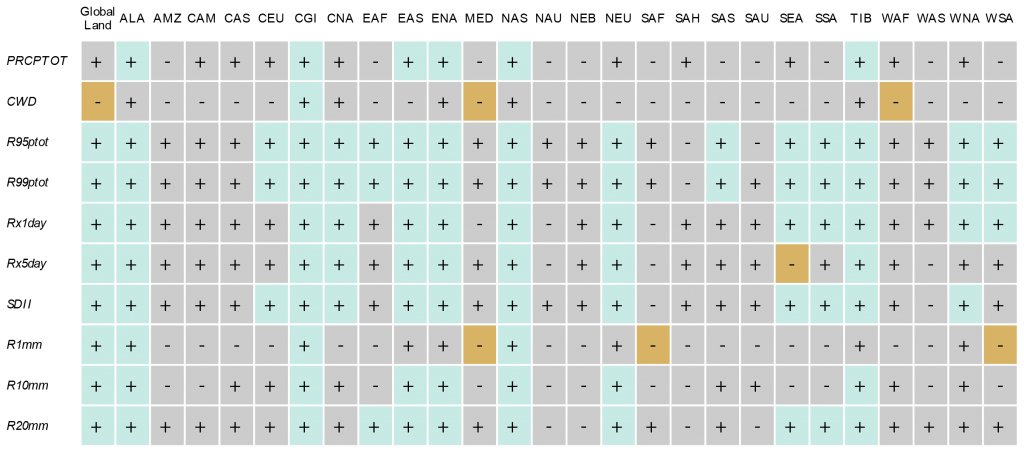
Significance of differences in regional mean precipitation and range of precipitation indices between the 1.5°C and 2°C global mean temperature targets (rows).
Definition of indices: PRCPTOT: mean precipitation; CWD: consecutive wet days; R10mm: number of days with precipitation >10 mm; R1mm: number of days with precipitation >1 mm; R20mm: number of days with precipitation >20 mm; R95ptot: proportion of rain falling as 95th percentile or higher; R99ptot: proportion of rain falling as 99th percentile or higher; RX1day: intensity of maximum yearly 1-day precipitation; RX5day: intensity of maximum yearly 5-day precipitation; SDII: Simple Daily Intensity Index. Columns indicate analysed regions and global land (see Figure 3.2 for definitions). Significant differences are shown in light blue (wetting tendency) or brown (drying tendency) shading, with increases indicated with ‘+’ and decreases indicated with ‘–’, while non-significant differences are shown in grey shading. The underlying methodology and the data basis are the same as in Figure 3.8 (see Supplementary Material 3.SM.2 for more details).