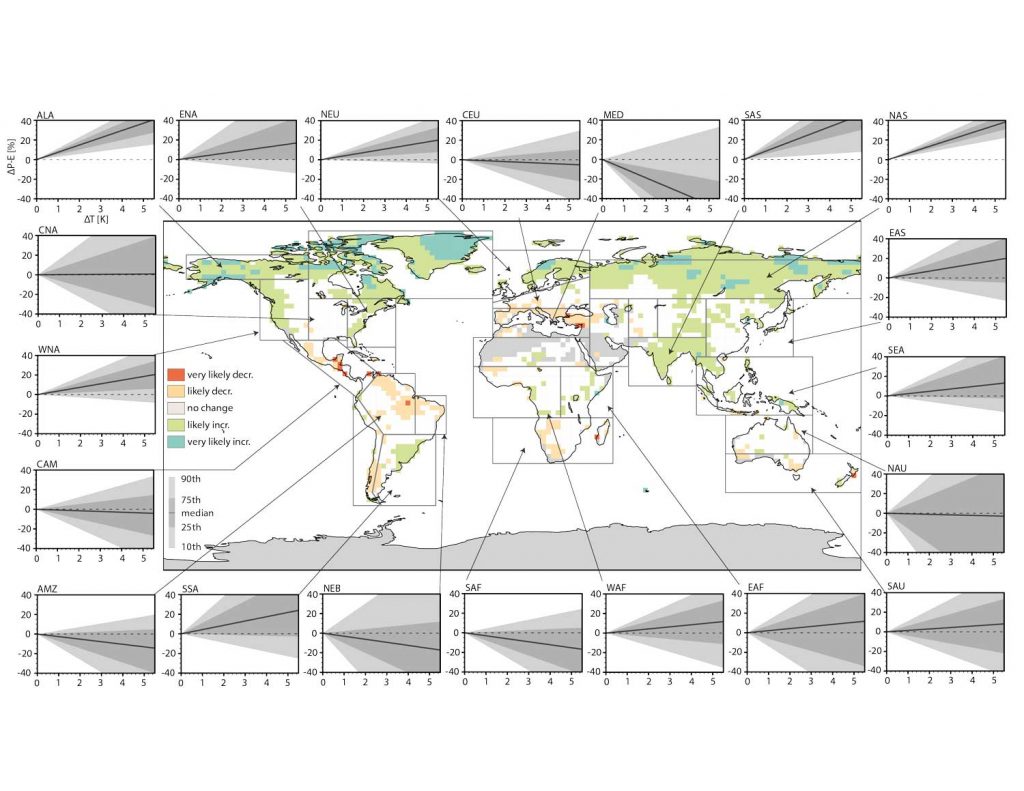
Summary of the likelihood of increases/decreases in precipitation minus evapotranspiration (P–E) in Coupled Model Intercomparison Project Phase 5 (CMIP5) simulations considering all scenarios and a representative subset of 14 climate models (one from each modelling centre).
Panel plots show the uncertainty distribution of the sensitivity of P–E to global temperature change, averaged for most IPCC Special Report on Managing the Risk of Extreme Events and Disasters to Advance Climate Change Adaptation (SREX) regions (see Figure 3.2) outlined in the map (from Greve et al., 2018).