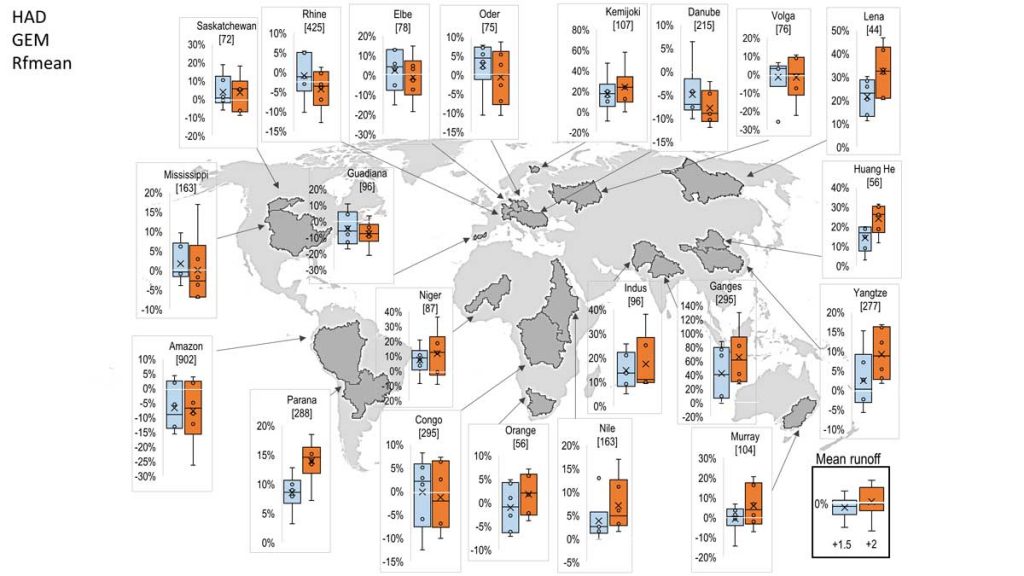
Runoff changes in twenty-one of the world’s major river basins at 1.5°C (blue) and 2°C (orange) of global warming, simulated by the Joint UK Land Environment Simulator (JULES) ecosystem–hydrology model under the ensemble of six climate projections.
Boxes show the 25th and 75th percentile changes, whiskers show the range, circles show the four projections that do not define the ends of the range, and crosses show the ensemble means. Numbers in square brackets show the ensemble-mean flow in the baseline (millimetres of rain equivalent) (Source: Betts et al., 2018).