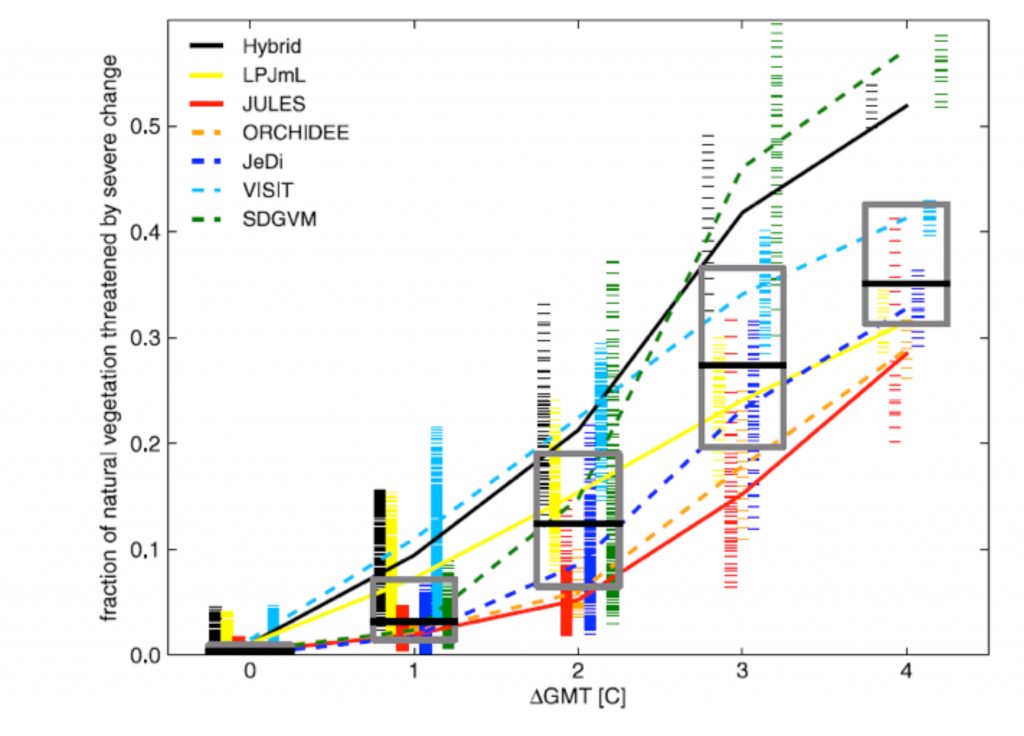
(a) Fraction of global natural vegetation (including managed forests) at risk of severe ecosystem change as a function of global mean temperature change for all ecosystems, models, global climate change models and Representative Concentration Pathways (RCPs).
The colours represent the different ecosystem models, which are also horizontally separated for clarity. Results are collated in unit-degree bins, where the temperature for a given year is the average over a 30-year window centred on that year. The boxes span the 25th and 75th percentiles across the entire ensemble. The short, horizontal stripes represent individual (annual) data points, the curves connect the mean value per ecosystem model in each bin. The solid (dashed) curves are for models with (without) dynamic vegetation composition changes. Source: (Warszawski et al., 2013)