Figure 3.16b

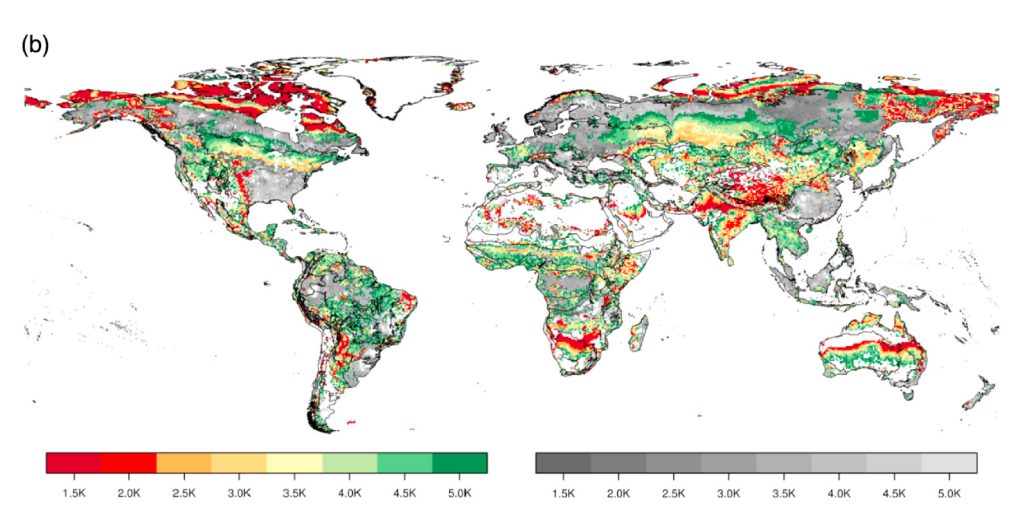
(b) Threshold level of global temperature anomaly above pre-industrial levels that leads to significant local changes in terrestrial ecosystems.

Regions with severe (coloured) or moderate (greyish) ecosystem transformation; delineation refers to the 90 biogeographic regions. All values denote changes found in >50% of the simulations. Source: (Gerten et al., 2013). Regions coloured in dark red are projected to undergo severe transformation under a global warming of 1.5°C while those coloured in light red do so at 2°C; other colours are used when there is no severe transformation unless global warming exceeds 2°C.