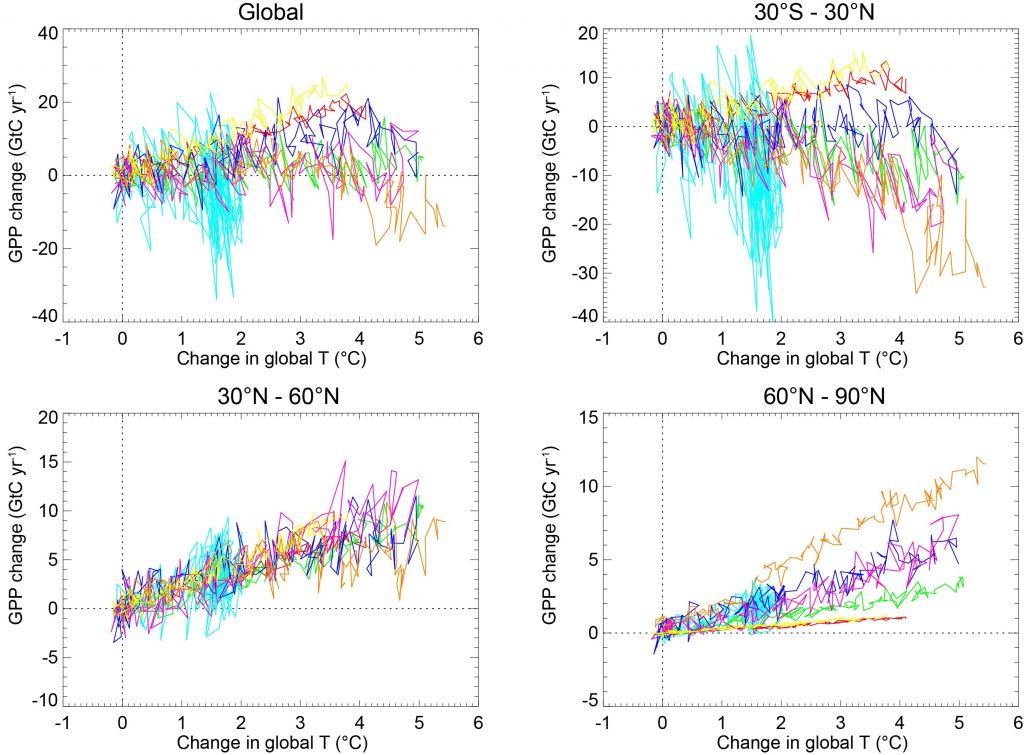
The response of terrestrial productivity (gross primary productivity, GPP) to climate change, globally (top left) and for three latitudinal regions: 30°S–30°N; 30–60°N and 60–90°N.
Data come from the Coupled Model Intercomparison Project Phase 5 (CMIP5) archive (http://cmip-pcmdi.llnl.gov/cmip5/). Seven Earth System Models were used: Norwegian Earth System Model (NorESM-ME, yellow); Community Earth System Model (CESM, red); Institute Pierre Simon Laplace (IPLS)-CM5-LR (dark blue); Geophysical Fluid Dynamics Laboratory (GFDL, pale blue); Max Plank Institute-Earth System Model (MPI-ESM, pink); Hadley Centre New Global Environmental Model 2-Earth System (HadGEM2-ES, orange); and Canadian Earth System Model 2 (CanESM2, green). Differences in GPP between model simulations with (‘1pctCO2’) and without (‘esmfixclim1’) the effects of climate change are shown. Data are plotted against the global mean temperature increase above pre-industrial levels from simulations with a 1% per year increase in CO2 (‘1pctCO2’).