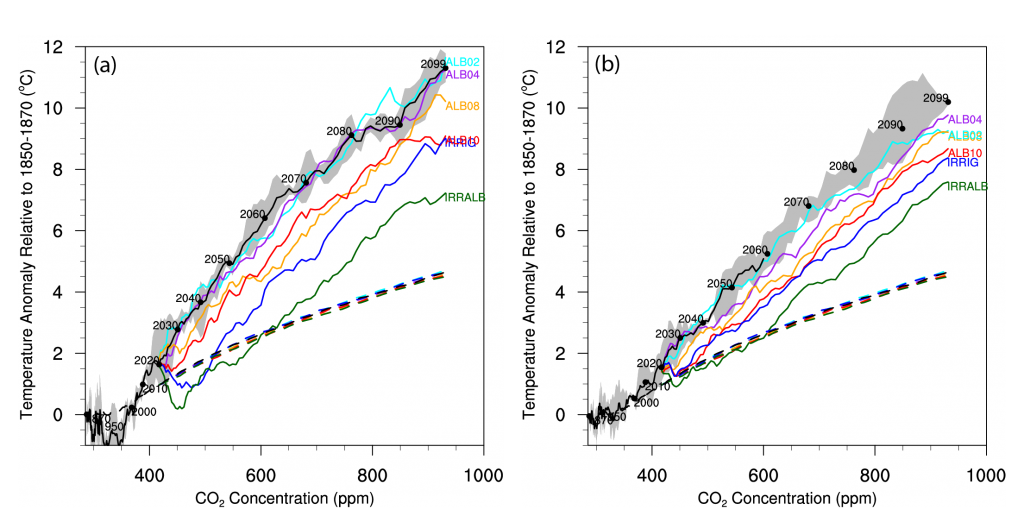
Solid lines correspond to the regional average annual maximum daytime temperature (TXx) anomaly, and dashed lines correspond to the global mean temperature anomaly, where all temperature anomalies are relative to 1850–1870 and units are degrees Celsius. The black line in all panels denotes the three-member control ensemble mean, with the grey shaded regions corresponding to the ensemble range. The coloured lines represent the three-member ensemble means of the experiments corresponding to albedo +0.02 (cyan), albedo +0.04 (purple), albedo + 0.08 (orange), albedo +0.10 (red), irrigation (blue), and irrigation with albedo +0.10 (green). Adapted from Hirsch et al. (2017).