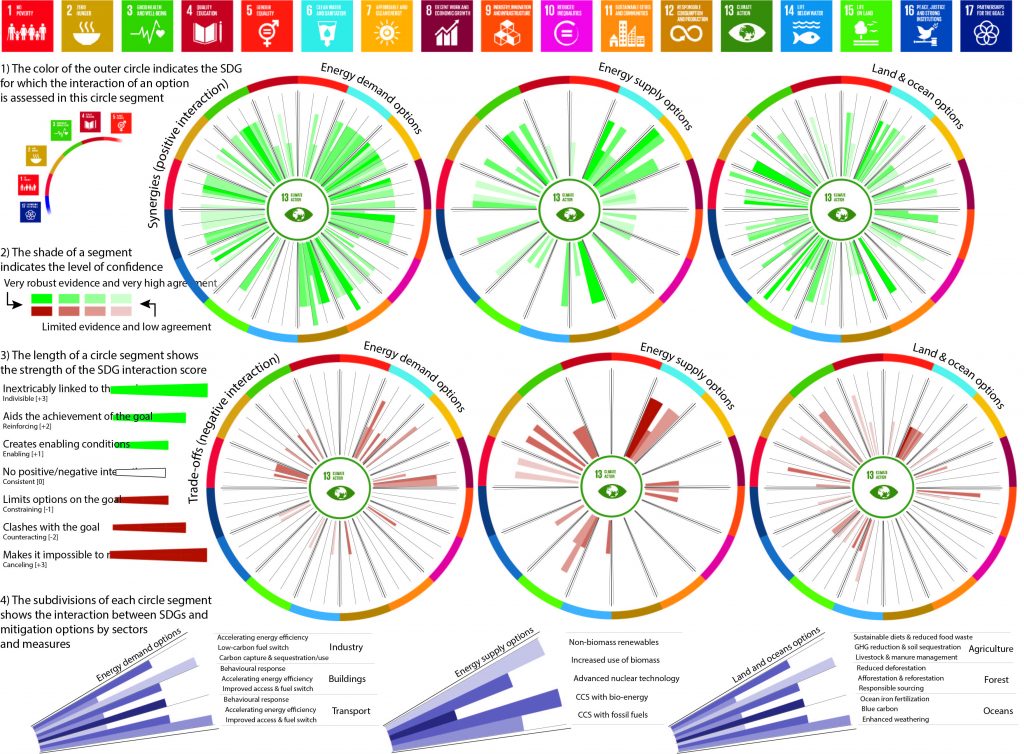
Synergies and trade-offs and gross Sustainable Development Goal (SDG)-interaction with individual mitigation options.
The top three wheels represent synergies and the bottom three wheels show trade-offs. The colours on the border of the wheels correspond to the SDGs listed above, starting at the 9 o’clock position, with reading guidance in the top-left corner with the quarter circle (Note 1). Mitigation (climate action, SDG 13) is at the centre of the circle. The coloured segments inside the circles can be counted to arrive at the number of synergies (green) and trade-offs (red). The length of the coloured segments shows the strength of the synergies or trade-offs (Note 3) and the shading indicates confidence (Note 2). Various mitigation options within the energy demand sector, energy supply sector, and land and ocean sector, and how to read them within a segment are shown in grey (Note 4). See also Table 5.2.