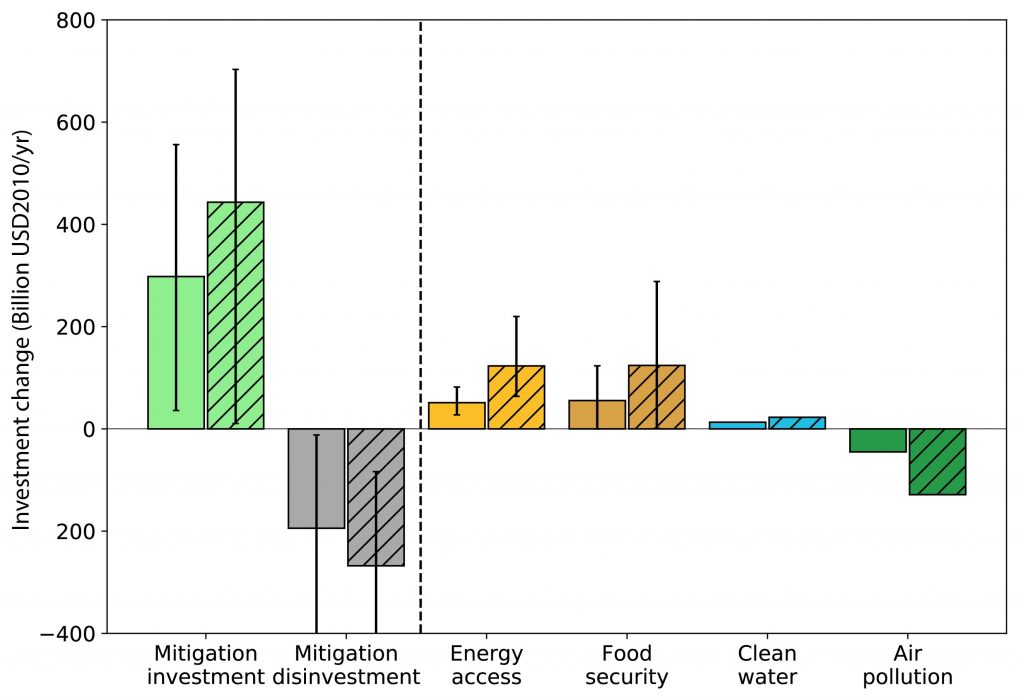
Investment into mitigation up until 2030 and implications for investments for four sustainable development dimensions.
Cross-hatched bars show the median investment in 1.5°C pathways across results from different models, and solid bars for 2°C pathways, respectively. Whiskers on bars represent minima and maxima across estimates from six models. Clean water and air pollution investments are available only from one model. Mitigation investments show the change in investments across mitigation options compared to the baseline. Negative mitigation investments (grey bars) denote disinvestment (reduced investment needs) into fossil fuel sectors compared to the baseline. Investments for different sustainable development dimensions denote the investment needs for complementary measures in order to avoid trade-offs (negative impacts) of mitigation. Negative sustainable development investments for air pollution indicate cost savings, and thus synergies of mitigation for air pollution control costs. The values compare to about 2 trillion USD2010 (range of 1.4 to 3 trillion) of total energy-related investments in the 1.5°C pathways. Source: Estimates from CD-LINKS scenarios summarised by McCollum et al. (2018b).