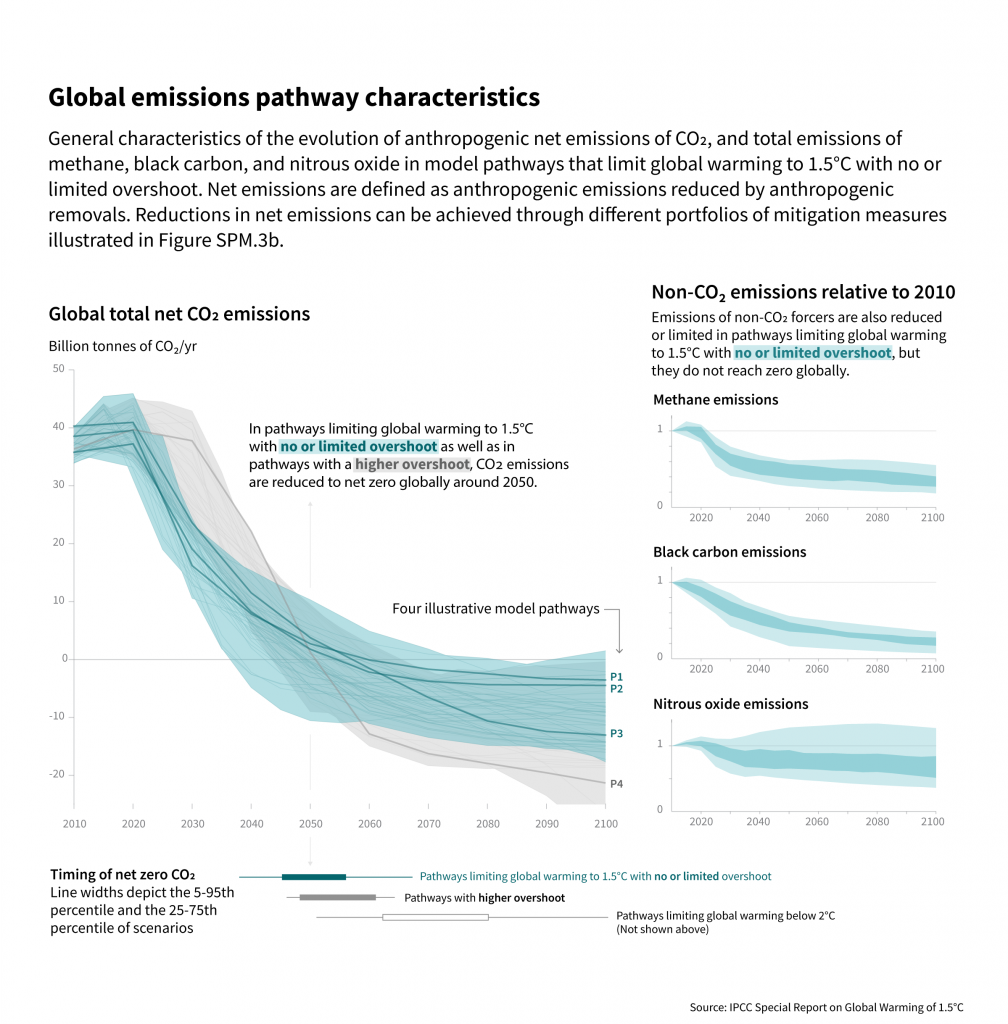
Figure SPM.3a
The main panel shows global net anthropogenic CO2 emissions in pathways limiting global warming to 1.5°C with no or limited (less than 0.1°C) overshoot and pathways with higher overshoot. The shaded area shows the full range for pathways analysed in this Report. The panels on the right show non-CO2 emissions ranges for three compounds with large historical forcing and a substantial portion of emissions coming from sources distinct from those central to CO2 mitigation. Shaded areas in these panels show the 5–95% (light shading) and interquartile (dark shading) ranges of pathways limiting global warming to 1.5°C with no or limited overshoot. Box and whiskers at the bottom of the figure show the timing of pathways reaching global net zero CO2 emission levels, and a comparison with pathways limiting global warming to 2°C with at least 66% probability. Four illustrative model pathways are highlighted in the main panel and are labelled P1, P2, P3 and P4, corresponding to the LED, S1, S2, and S5 pathways assessed in Chapter 2. Descriptions and characteristics of these pathways are available in Figure SPM.3b. {2.1, 2.2, 2.3, Figure 2.5, Figure 2.10, Figure 2.11}