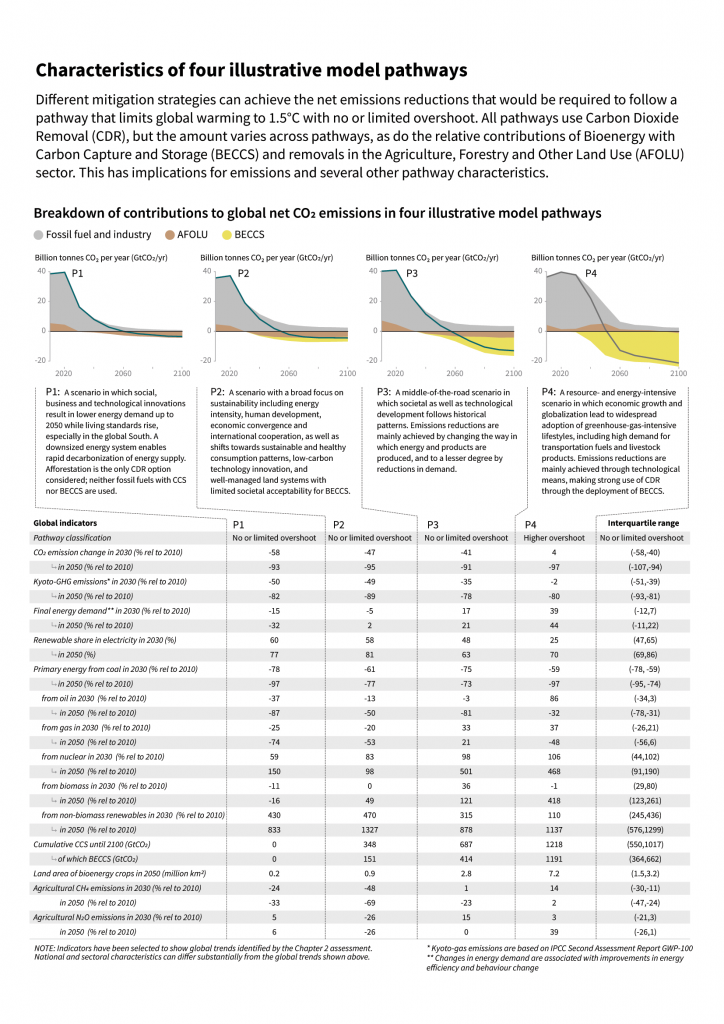
Figure SPM.3b
Characteristics of four illustrative model pathways in relation to global warming of 1.5°C introduced in Figure SPM.3a. These pathways were selected to show a range of potential mitigation approaches and vary widely in their projected energy and land use, as well as their assumptions about future socio-economic developments, including economic and population growth, equity and sustainability. A breakdown of the global net anthropogenic CO2 emissions into the contributions in terms of CO2 emissions from fossil fuel and industry; agriculture, forestry and other land use (AFOLU); and bioenergy with carbon capture and storage (BECCS) is shown. AFOLU estimates reported here are not necessarily comparable with countries’ estimates. Further characteristics for each of these pathways are listed below each pathway. These pathways illustrate relative global differences in mitigation strategies, but do not represent central estimates, national strategies, and do not indicate requirements. For comparison, the right-most column shows the interquartile ranges across pathways with no or limited overshoot of 1.5°C. Pathways P1, P2, P3 and P4 correspond to the LED, S1, S2, and S5 pathways assessed in Chapter 2 (Figure SPM.3a). {2.2.1, 2.3.1, 2.3.2, 2.3.3, 2.3.4, 2.4.1, 2.4.2, 2.4.4, 2.5.3, Figure 2.5, Figure 2.6, Figure 2.9, Figure 2.10, Figure 2.11, Figure 2.14, Figure 2.15, Figure 2.16, Figure 2.17, Figure 2.24, Figure 2.25, Table 2.4, Table 2.6, Table 2.7, Table 2.9, Table 4.1}