Cross-Chapter Paper 1: Biodiversity Hotspots


This cross-chapter paper should be cited as:
Costello, M.J., M.M. Vale, W. Kiessling, S. Maharaj, J. Price, and G.H. Talukdar, 2022: Cross-Chapter Paper 1: Biodiversity Hotspots. In: Climate Change 2022: Impacts, Adaptation and Vulnerability. Contribution of Working Group II to the Sixth Assessment Report of the Intergovernmental Panel on Climate Change [H.-O. Pörtner, D.C. Roberts, M. Tignor, E.S. Poloczanska, K. Mintenbeck, A. Alegría, M. Craig, S. Langsdorf, S. Löschke, V. Möller, A. Okem, B. Rama (eds.)]. Cambridge University Press, Cambridge, UK and New York, NY, USA, pp. 2123–2161, doi:10.1017/9781009325844.018.
Executive Summary 
Geographic areas that are exceptionally rich in species, ecologically distinct and/or show high endemism (species occurring in that defined geographic area and nowhere else) are broadly recognised as biodiversity hotspots and prioritised for conservation. Here, we assess the impacts and vulnerability to climate change of terrestrial, freshwater and marine regions considered to be biodiversity hotspots. {CCP1.1}
Species in biodiversity hotspots already show changes in response to climate change (high confidence1 ). The geographic ranges of the animal and plant species assessed have shifted from low to high latitudes in response to climate warming on land and in the ocean (very high confidence). On land, climate change-induced shifts towards higher elevations are also common in biodiversity hotspots (high confidence); while, in the ocean, climate-induced shifts to greater water depths are little studied. In the ocean, abrupt mortality of habitat-forming species on coral reefs and kelp forests, especially following heatwaves, are increasing in frequency in biodiversity hotspots (high confidence). {CCP1.2.1; 1.2.2; 1.2.4}
All biodiversity hotspots are impacted, to differing degrees, by human activities (veryhigh confidence). Climate change impacts are compounded by other anthropogenic impacts. These include habitat loss and fragmentation, hunting, fishing and its bycatch, over-exploitation, water abstraction, nutrient enrichment, pollution, human introduction of invasive species, pests and diseases. All of these reduce climate resilience (very high confidence), complicating the attribution of observed changes to climate change. {CCP1.2.1}
Observed climate velocities are approximately 20% lower inside than outside of terrestrial and freshwater biodiversity hotspots, but 69% higher inside than outside marine hotspots (high confidence). In spite of the lower climate velocities inside terrestrial hotspots, these areas are not projected to serve as effective climate refugia from the effects of global warming, especially for endemic species (unique to a hotspot) (medium confidence). The greater climate velocities inside marine hotspots exposes their species to greater climate-induced pressures inside than outside hotspots (high confidence). The differences between temperatures inside and outside of hotspots narrow with increasing warming (medium confidence). {CCP1.2.2}
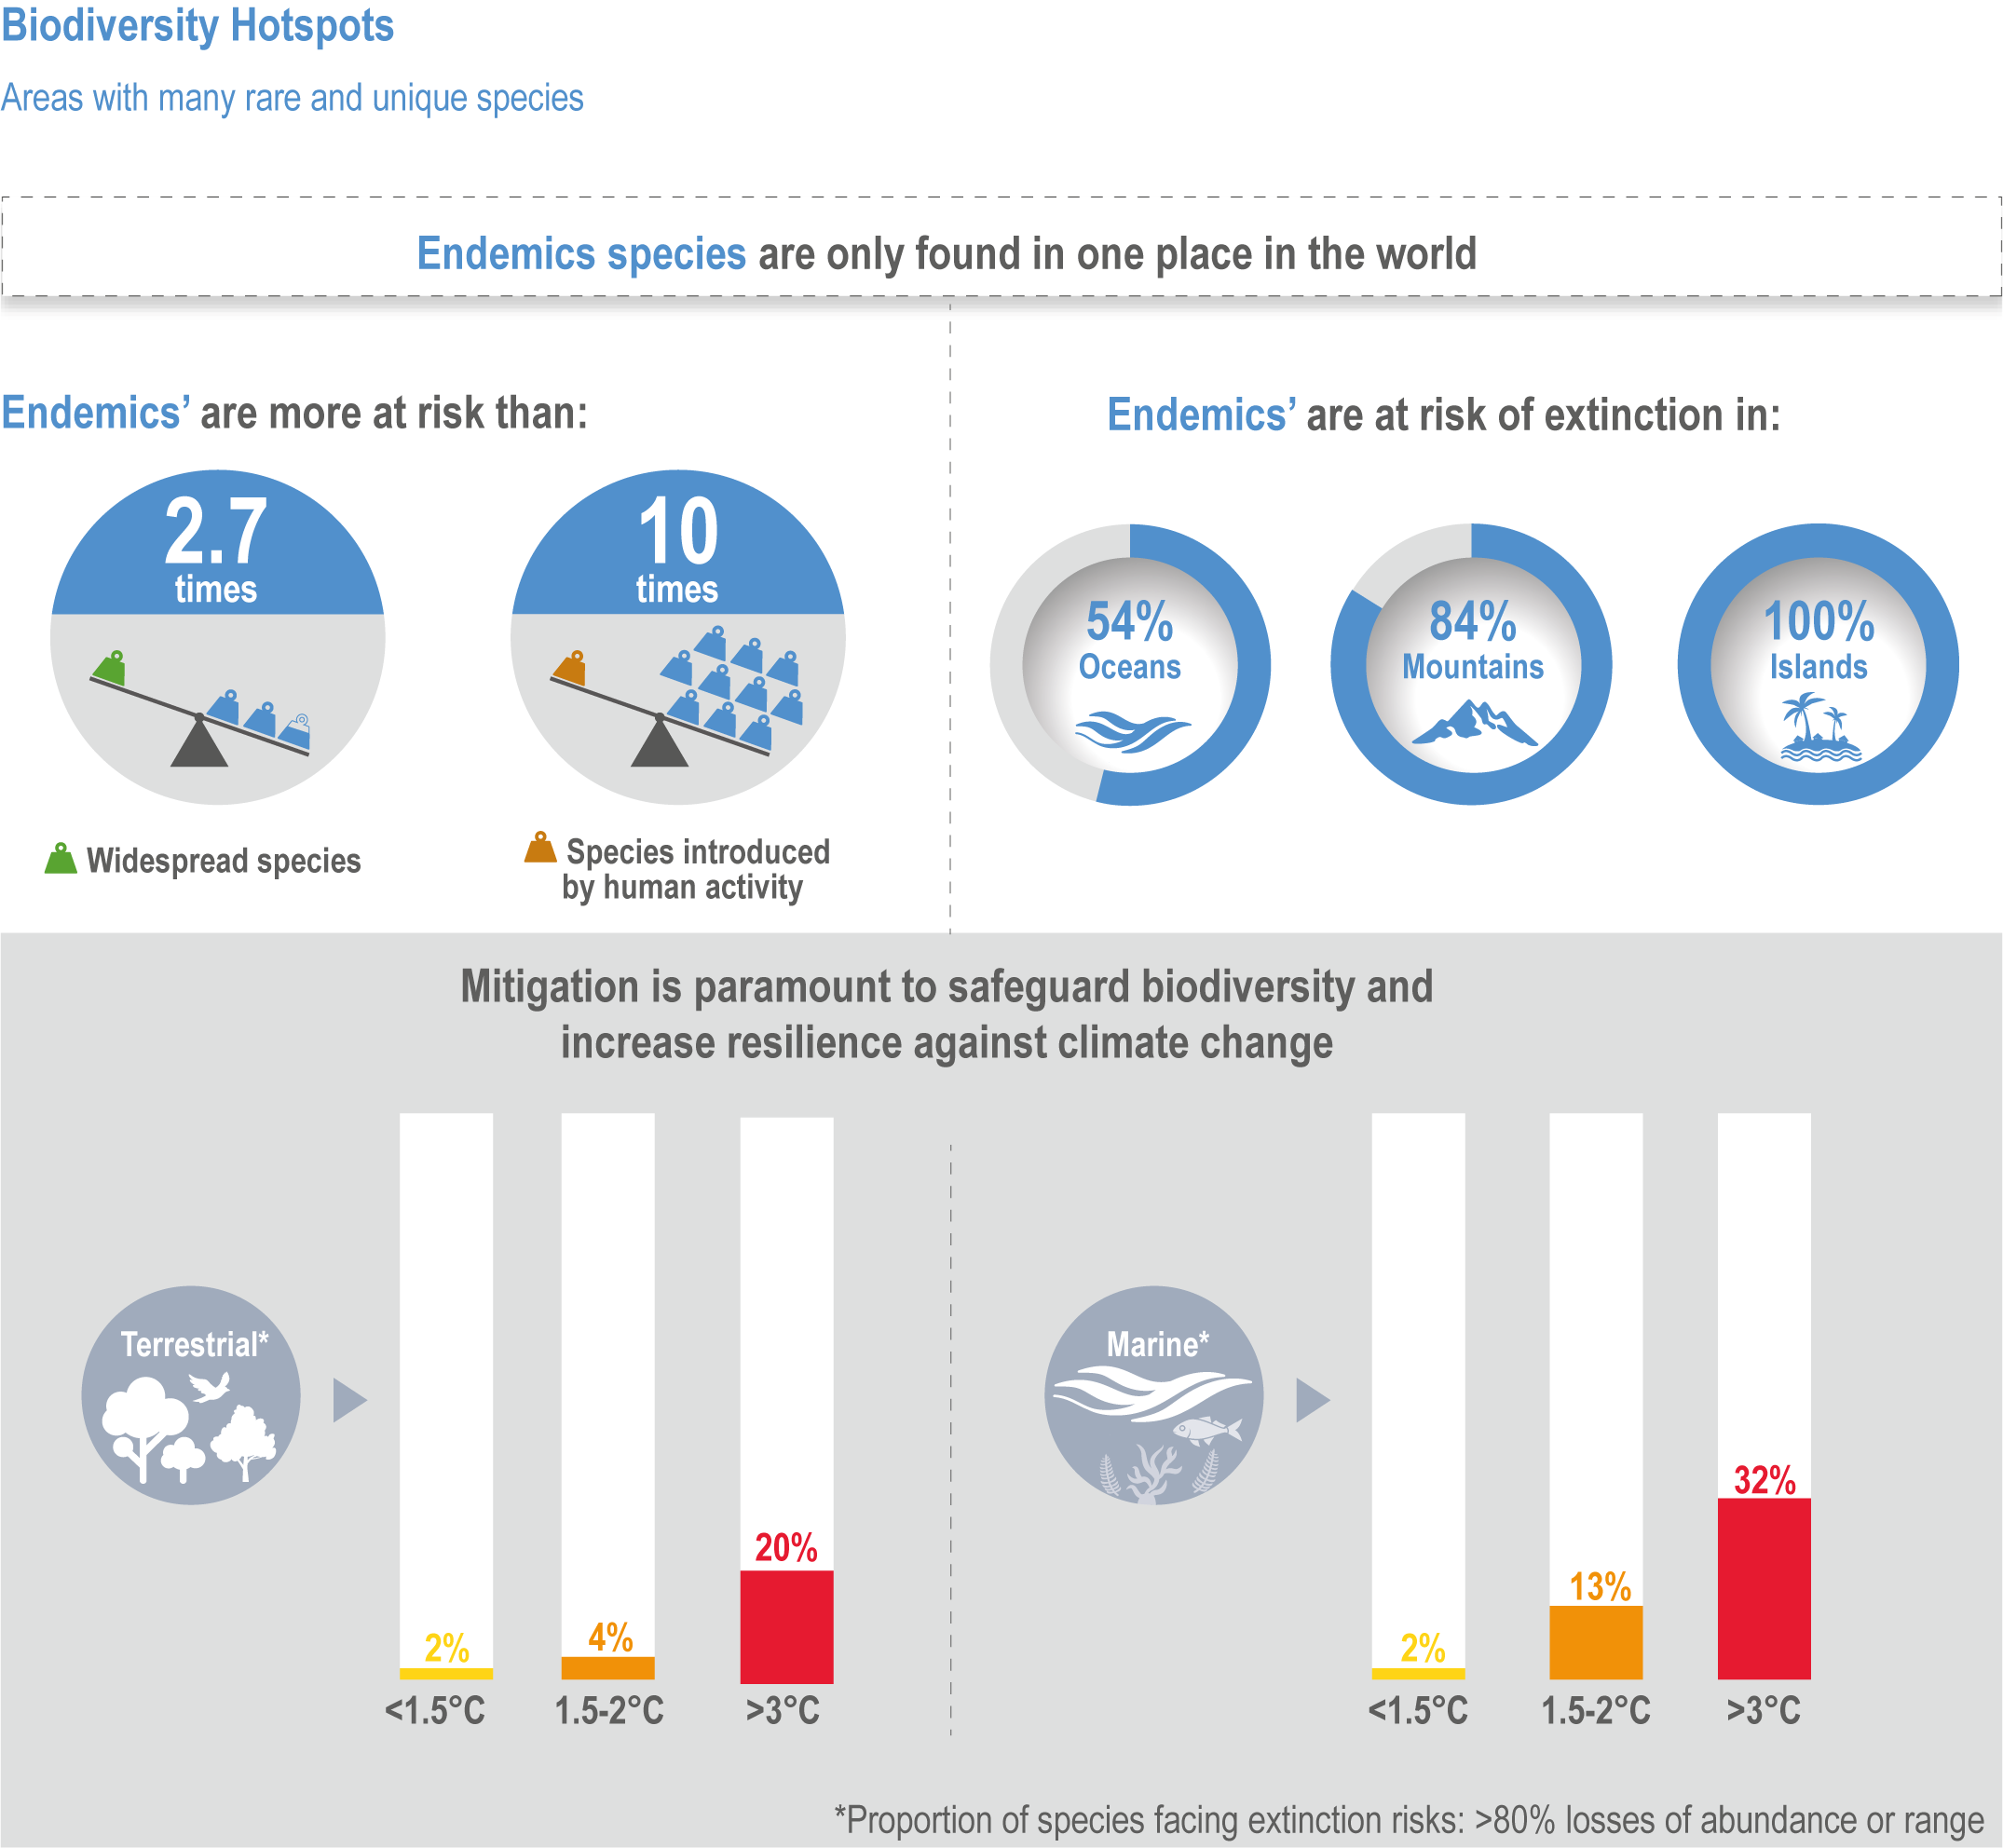
The risk of species extinction increases with warming in all climate change projections for native species studied in hotspots (high confidence), being about 10-times greater for endemic species from 1.5°C to 3°C above pre-industrial levels (medium confidence). Of the 6116 projections for more than 2700 species assessed in biodiversity hotspots, ~44% were found to be at high extinction risk, and ~24% at very high extinction risk due to climate change (medium confidence). Very high extinction risk in biodiversity hotspots due to climate change is more common for endemic species than other native species (high confidence). For these endemic species, considering all scenarios and time periods evaluated, ~100% on islands, ~84% on mountains, ~12% on continents (medium confidence) and ~54% in the ocean (notably the Mediterranean) (low confidence) are projected to be threatened with extinction due to climate change. With further warming, increasingly high risks of local and global extinctions are projected in biodiversity hotspots from climate-related stressors (high confidence). {CCP1.2.1; Figure CCP1.7; Figure CCP1.6}
Adaptation options can enhance the persistence of biodiversity in hotspots (high confidence). Noting that over 3 billion people live within biodiversity hotspots, reduction of existing (non-climatic) pressures due to human activities is critical for building resilience within hotspots. Adaptation options for biodiversity (e.g., expanding fully protected areas, restoration and sustainable use practices) are as applicable inside biodiversity hotspots as outside (high confidence). Nevertheless, the protection of biodiversity hotspots is key to preventing a substantial global biodiversity decline from climate change. {CCP1.3; 2.6; 3.6; Table CCP1.2; Cross-Chapter Box NATURAL in Chapter 2}.
CCP1.1 Point of Departure
Biodiversity hotspots are geographic areas with an exceptionally high richness of species, including rare and endemic species. Such hotspots have deep evolutionary roots and are concentrated in areas where past climatic variability was moderate (Enquist et al., 2019; Brown et al., 2020; Trew and Maclean, 2021). An important limitation of the biodiversity hotspot concept is that there may be species highly threatened with extinction that do not occur within what has traditionally been classified as a hotspot (Grenyer et al., 2006). Thus, biodiversity hotspot assessments need to be paralleled by assessments of highly endangered species, and the threats they face.
Many studies have proposed biodiversity hotspots based on different criteria, taxa and geographic contexts (e.g., Myers et al., 2000; Mittermeier et al., 2004; Mittermeier et al., 2011; Williams et al., 2011; Noss et al., 2015; Asaad et al., 2017). A coherent comparative assessment of all such schemes is beyond the scope of this chapter but is provided in recent reviews (Asaad et al., 2017; Jefferson and Costello, 2019). We base this assessment on the ‘WWF Global 200’ areas of conservation importance (Olson and Dinerstein, 2002). These 238 ecoregions have been used in a previous climate risk assessment (Warren et al., 2018b) and cover terrestrial, freshwater and marine environments (Table CCP1.1; Figures CCP1.1; CCP1.2). In addition, we included terrestrial ‘biodiversity hotspots’ as defined by Myers et al. (2000) and extended later (Mittermeier et al., 2011; Williams et al., 2011; Noss et al., 2015). This assessment thus covers the ‘Global 200’ (hereafter G200) and ‘Myers’ biodiversity hotspots, rather than particular species or ecological systems, such as rainforests, coral reefs or the deep sea. Such systems are assessed in Chapters 2 and 3. Chapters 2 and 3 also cover observed and projected impacts, changes in ecosystem functioning, and species extinction risks at a global level.
Biodiversity hotspots were not explicitly covered in the Working Group II (WGII) Fifth Assessment Report (IPCC, 2014) (hereafter AR5). Thus, the point of departure is WGII AR4 (IPCC, 2007), which assessed that climate change exacerbates biodiversity risks in hotspots and that 15–40% of endemic species (species only occurring in one region) were projected to become extinct at 3.5°C global warming (Fischlin et al., 2007). Risks of extinction are assessed using the guidelines in Chapter 2, with species projected to lose 80% of their range or abundance being classified as at very high risk of extinction and those projected to lose 50% being at high risk of extinction (Figure 2.8 for definitions and a global overview).
CCP1.2 Assessment
Specific hotspot numbers (H) are indicated in this chapter text to aid their identification in Table CCP1.1 and Figures CCP1.1 and CCP1.2.
Table CCP1.1 | List of biodiversity hotspots names from (Olson and Dinerstein, 2002) as mapped in Figures CCP1.1 for terrestrial (numbered 1 to 142) and CCP1.2 for freshwater (143 to 195) and marine (196 to 238). Hotspots containing islands (>100 km 2) are indicated with an asterisk.
|
|
|
|
|
|
|
|
|
|
|
|
|
|
|
|
|
|
|
|
|
|
|
|
|
|
|
|
|
|
|
|
|
|
|
|
|
|
|
|
|
|
|
|
|
|
|
|
|
|
|
|
|
|
|
|
|
|
|
|
|
|
|
|
|
|
|
|
|
|
|
|
|
|
|
|
|
|
|
|
|
|
|
|
|
|
|
|
|
|
|
|
|
|
|
|
|
|
|
|
|
|
|
|
|
|
|
|
|
|
|
|
|
|
|
|
|
|
|
|
|
|
|
|
|
|
|
|
|
|
|
|
|
|
|
|
|
|
|
|
|
|
|
|
|
|
|
|
|
|
|
|
|
|
|
|
|
|
|
|
|
|
|
|
|
|
|
|
|
|
|
|
|
|
|
|
|
|
|
|
|
|
|
|
|
|
|
|
|
|
|
|
|
|
|
|
|
|
|
|
|
|
|
|
|
|
|
|
|
|
|
|
|
|
|
|
|
|
|
|
|
|
|
|
|
76 Madagascar Mangroves* | 156 Guianan Freshwater | 236 Great Barrier Reef* |
77 Madagascar Dry Forests* | 157 Amazon River and Flooded Forests* | 237 Lord Howe-Norfolk Islands Marine |
78 Seychelles and Mascarenes Moist Forests* | 158 Upper Paraná Rivers and Streams | 238 New Zealand Marine* |
79 Madagascar Forests and Shrublands* | 159 Volga River Delta | |
80 Madagascar Spiny Thicket* | 160 Mesopotamian Delta and Marshes* |

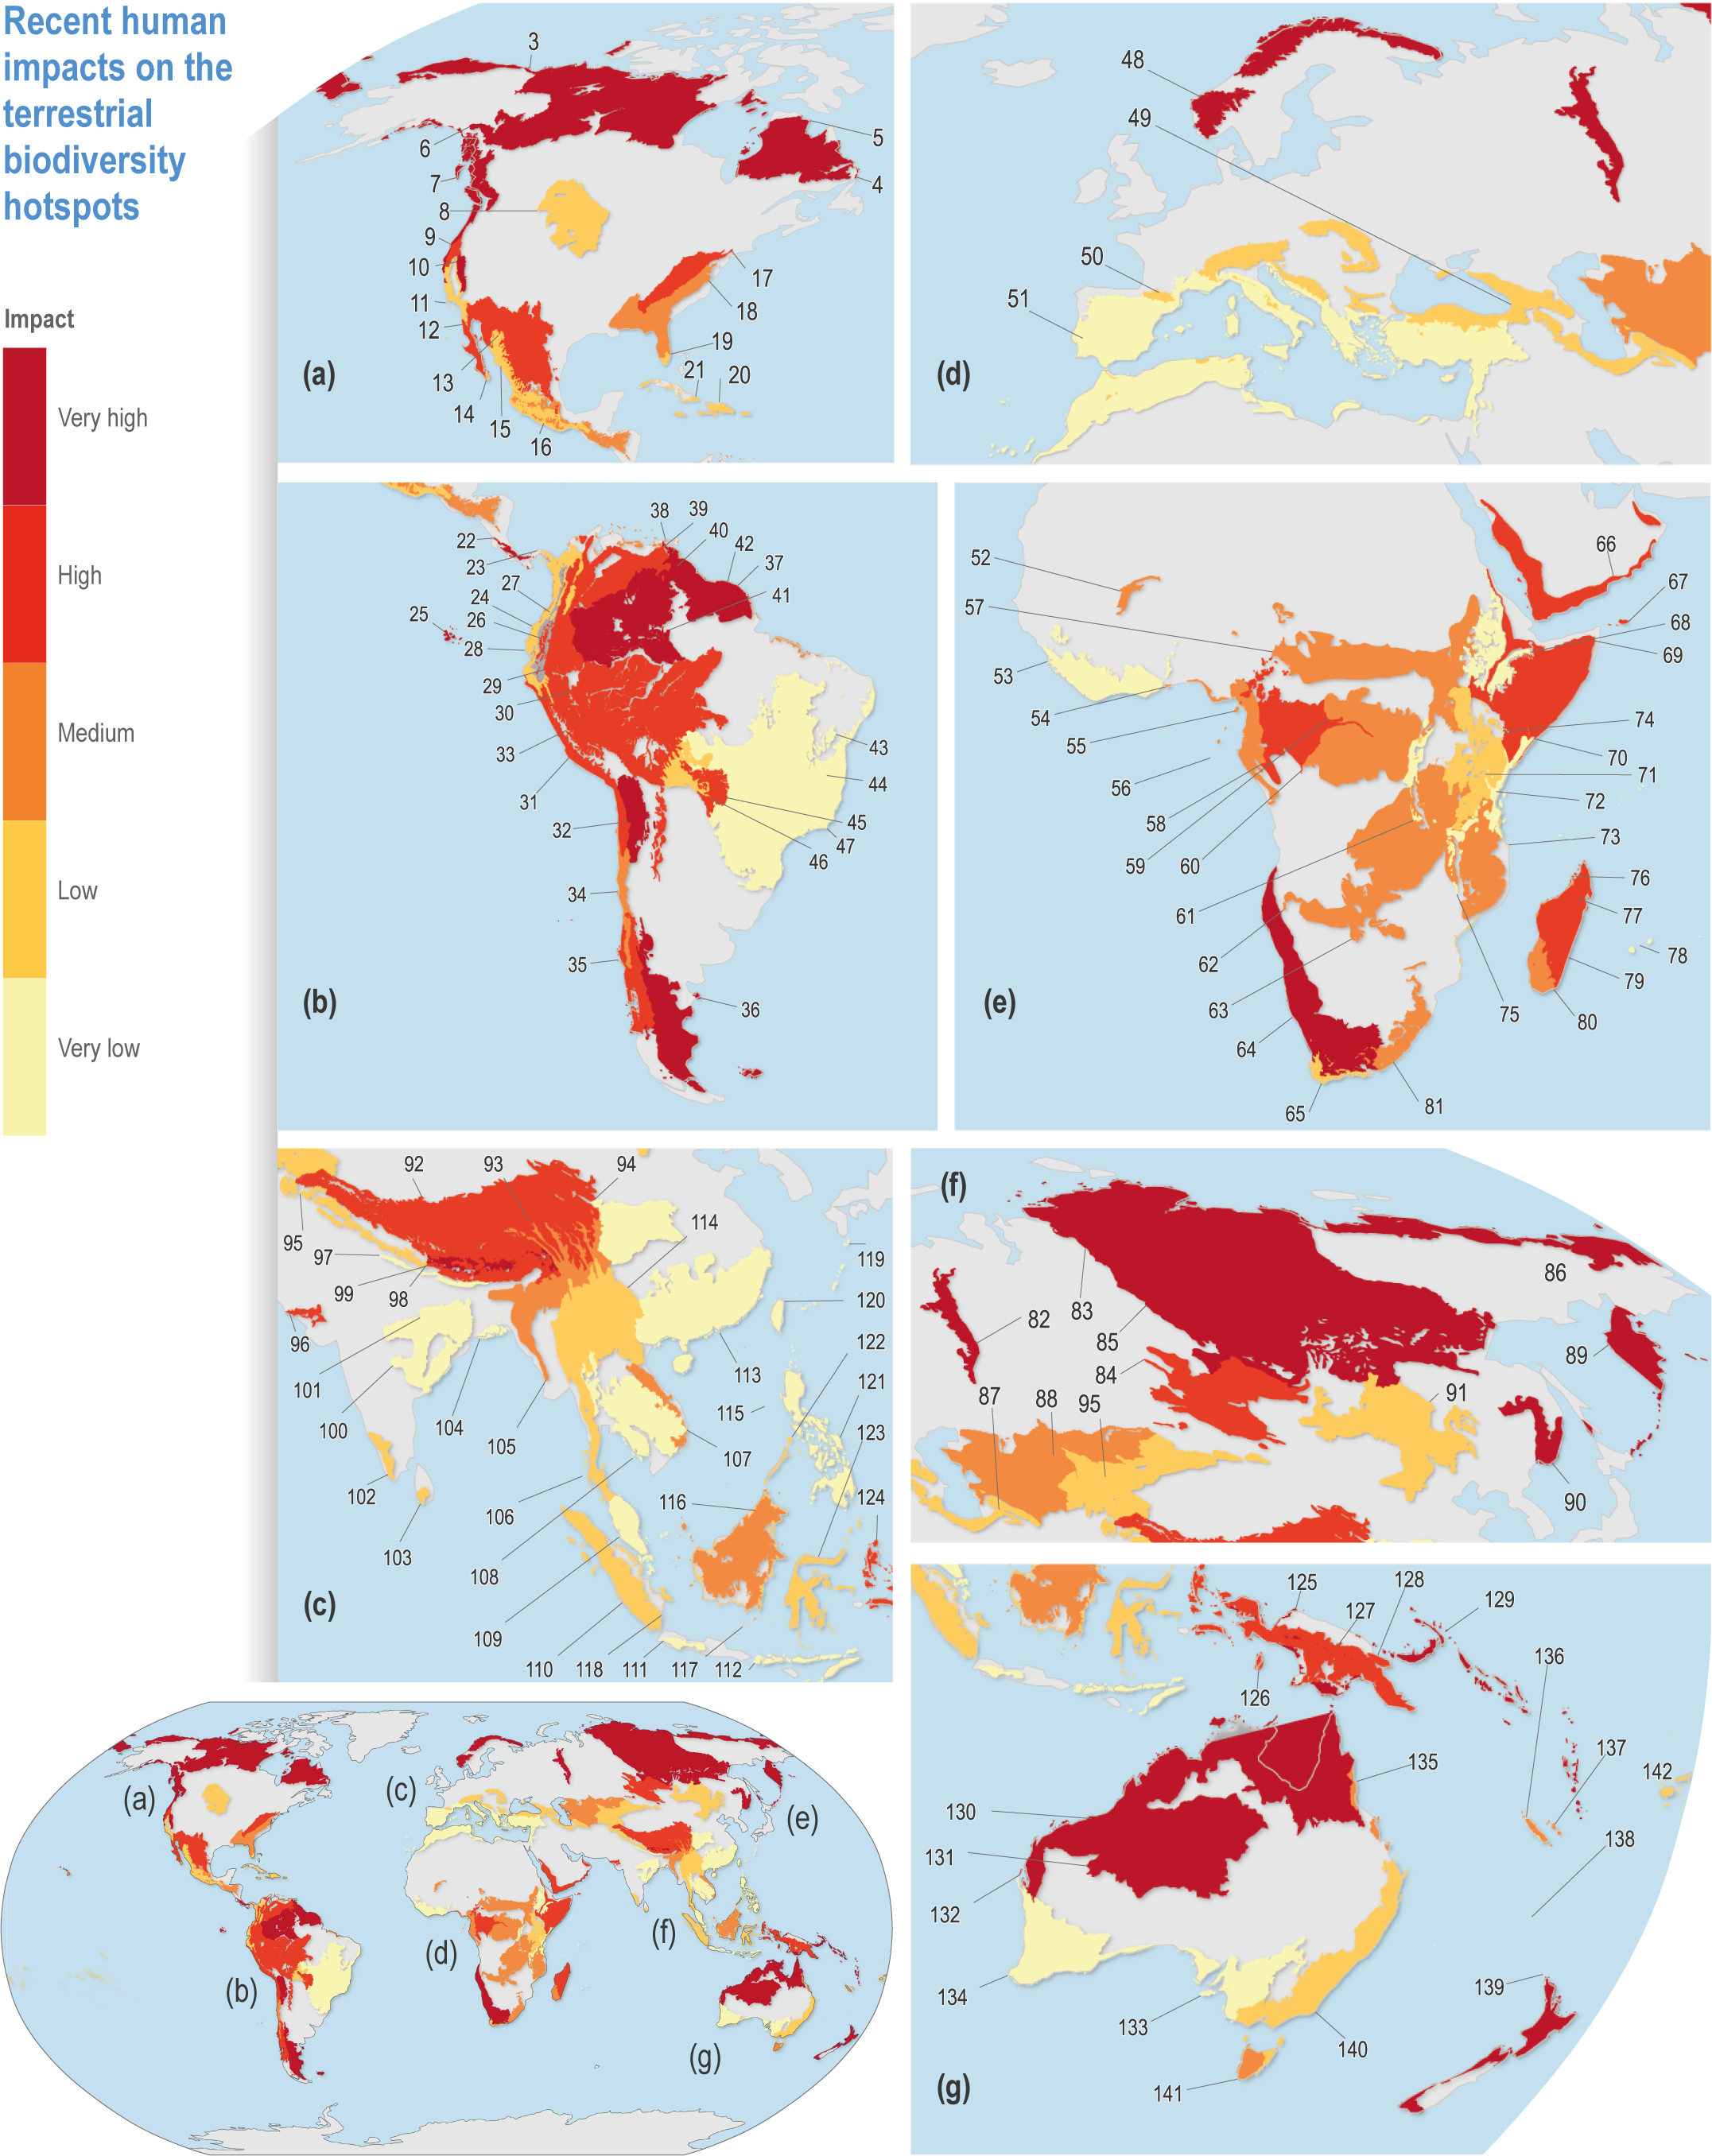
Figure CCP1.1 | Recent human impacts on the terrestrial biodiversity hotspots (coloured, grey is non hotspot) (Table CCP1. SM.1). Impacts are scaled in five equal 20% categories. (a) North and Central America; (b) South America; (c) Southeast Asia; (d) Europe and North Africa; (e) Africa and Arabia; (f) North Asia; (g) Southeast Asian archipelagos, Australia and New Zealand. See Table CCP1.1 for key to hotspot numbers.
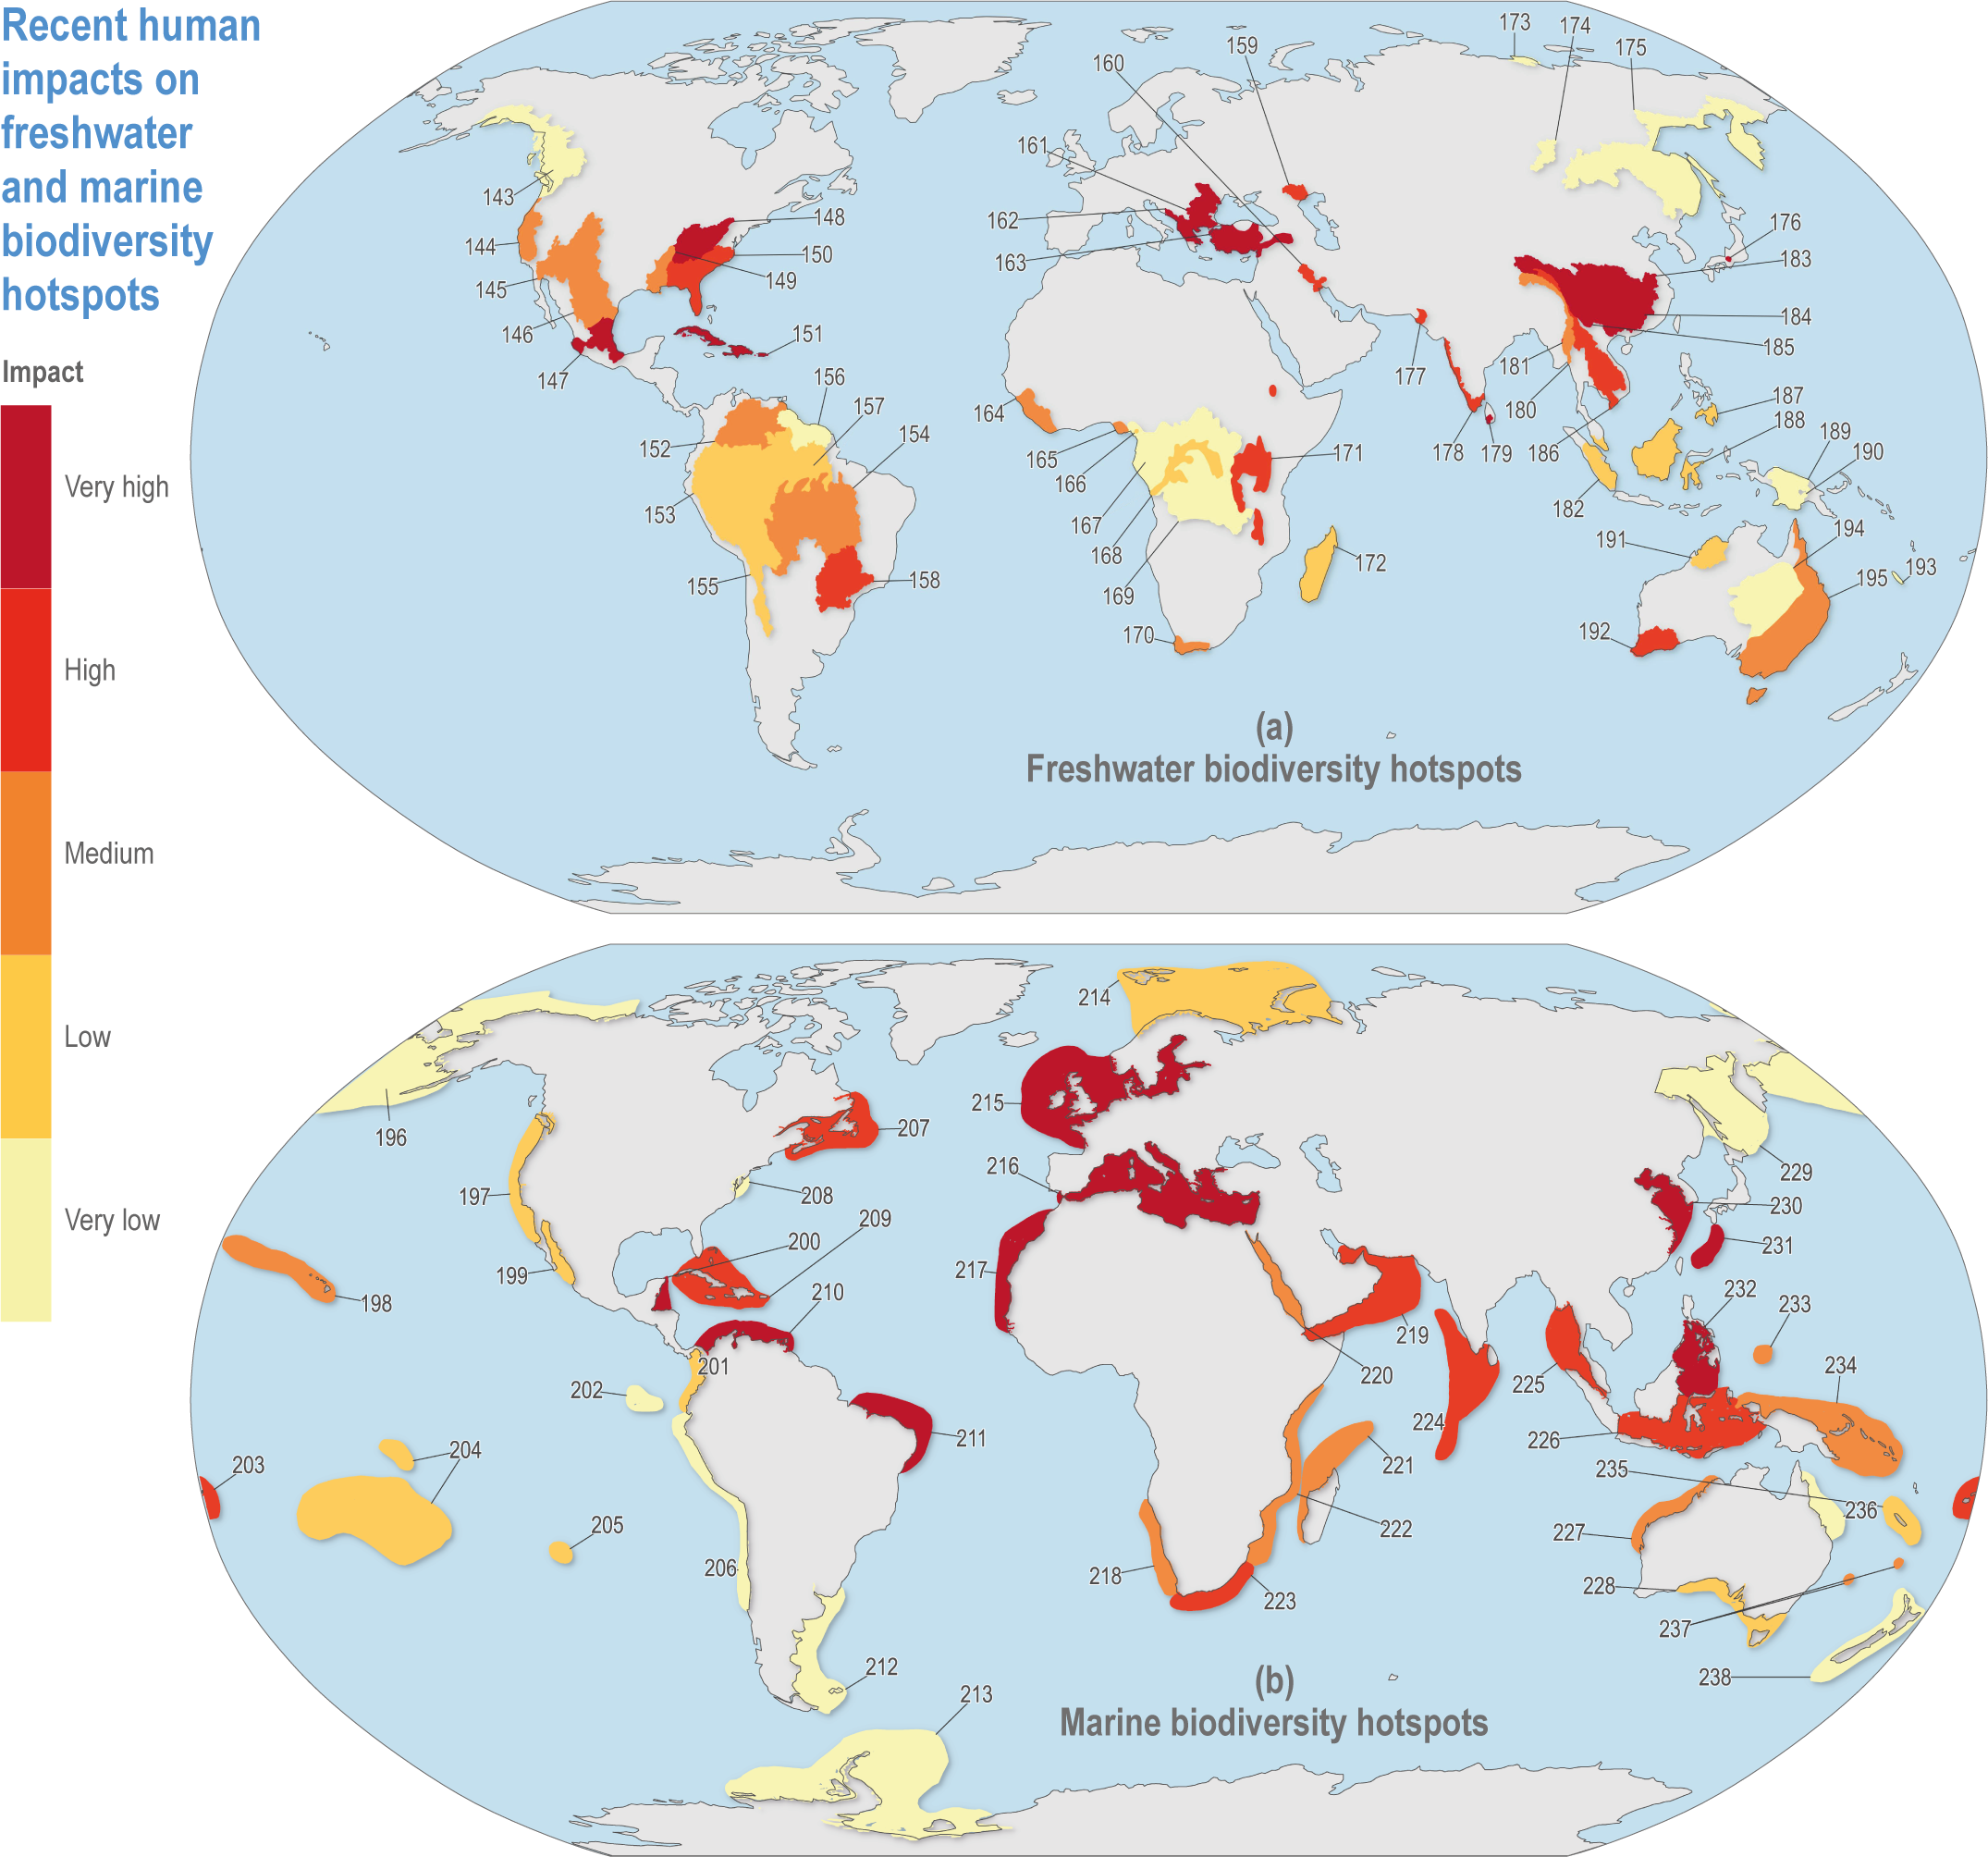
Figure CCP1.2 | Recent human impacts from multiple factors on (a) freshwater hotspots since 2000, based on Janse et al. (2015) and (b) marine hotspots based on Halpern et al. (2015). Human impacts in freshwater areas refer to the remaining wilderness. Marine impacts represent land-based, fishing, climate change and ocean-based stressors. Impacts are scaled into five equal 20% categories. See Table CCP1.1 for the key to hotspot numbers.
CCP1.2.1 Global Perspective
CCP1.2.1.1 Observed Impacts
CCP1.2.1.1.1 Observed climatic hazards
Terrestrial and freshwater hotspots have been warming less over the last 50 years than non-hotspot areas, whereas marine hotspots have been warming more (Kocsis et al., 2021). The warming inside terrestrial hotspots is 0.91°C (Myers) and 1.04°C (G200), respectively, while for freshwater hotspots it is 0.89°C, compared to 1.08°C warming outside (Kocsis et al., 2021). In contrast, mean annual sea surface temperatures in the G200 marine biodiversity hotspots have warmed 41% more than the regions outside (0.53°C compared with 0.38°C) (Kocsis et al., 2021). Thus, terrestrial biodiversity hotspots have been warming slightly less, and marine hotspots considerably more than non-hotspots (medium confidence).
Climate velocity, the direction and pace of movement in climate variables (typically temperature) in space, is key to understanding the origin and fate of biodiversity hotspots under climate change (Loarie et al., 2009; Burrows et al., 2011). Climate trajectories generally predict the direction and pace of past and future species range shifts (Pinsky et al., 2013; Brito-Morales et al., 2018), although there are exceptions (Fuchs et al., 2020). Spatial patterns of climate trajectories show regions where species are expected to leave, pass through, and/or arrive under climate change (Burrows et al., 2014). Regions of high climate velocities are those with low topographic relief on land, particularly flooded grasslands and deserts (Loarie et al., 2009), and tropical as well as offshore and polar sea regions (Burrows et al., 2011; Burrows et al., 2014; García Molinos et al., 2016; Brito-Morales et al., 2018; Brito-Morales et al., 2020).
On millennial time scales, some areas of low climate velocity have more endemic species and can be considered climate refugia, at least on land (Sandel et al., 2011) and, for marine species, around Antarctica (H213) (Costello et al., 2010). This suggests that, if these areas are subject to increased velocities, they will lose species that are not able to disperse fast enough to cope with the pace of climate change (medium confidence) (Sandel et al., 2011; Brito-Morales et al., 2018).
Climate velocities are 47% (Myers), 29% (G200, terrestrial) and 10% (G200, freshwater) lower inside biodiversity hotspots than outside, respectively (Kocsis et al., 2021), but are 69% higher inside marine hotspots than outside (medium confidence). Climate velocities from 1970 to 2019 ranged from 3–4 km per decade (terrestrial and freshwater) to ~11 km per decade in marine (Kocsis et al., 2021).
For terrestrial and freshwater hotspots, the highest climate velocities are in central South America, including the Amazon (H153, 154) (Figure CCP1.3). Terrestrial hotspots also have high velocities in the Arctic (H196, 214) and east of the Caspian Sea, while freshwater hotspots have low velocities in the eastern European Mediterranean and eastern Australia.
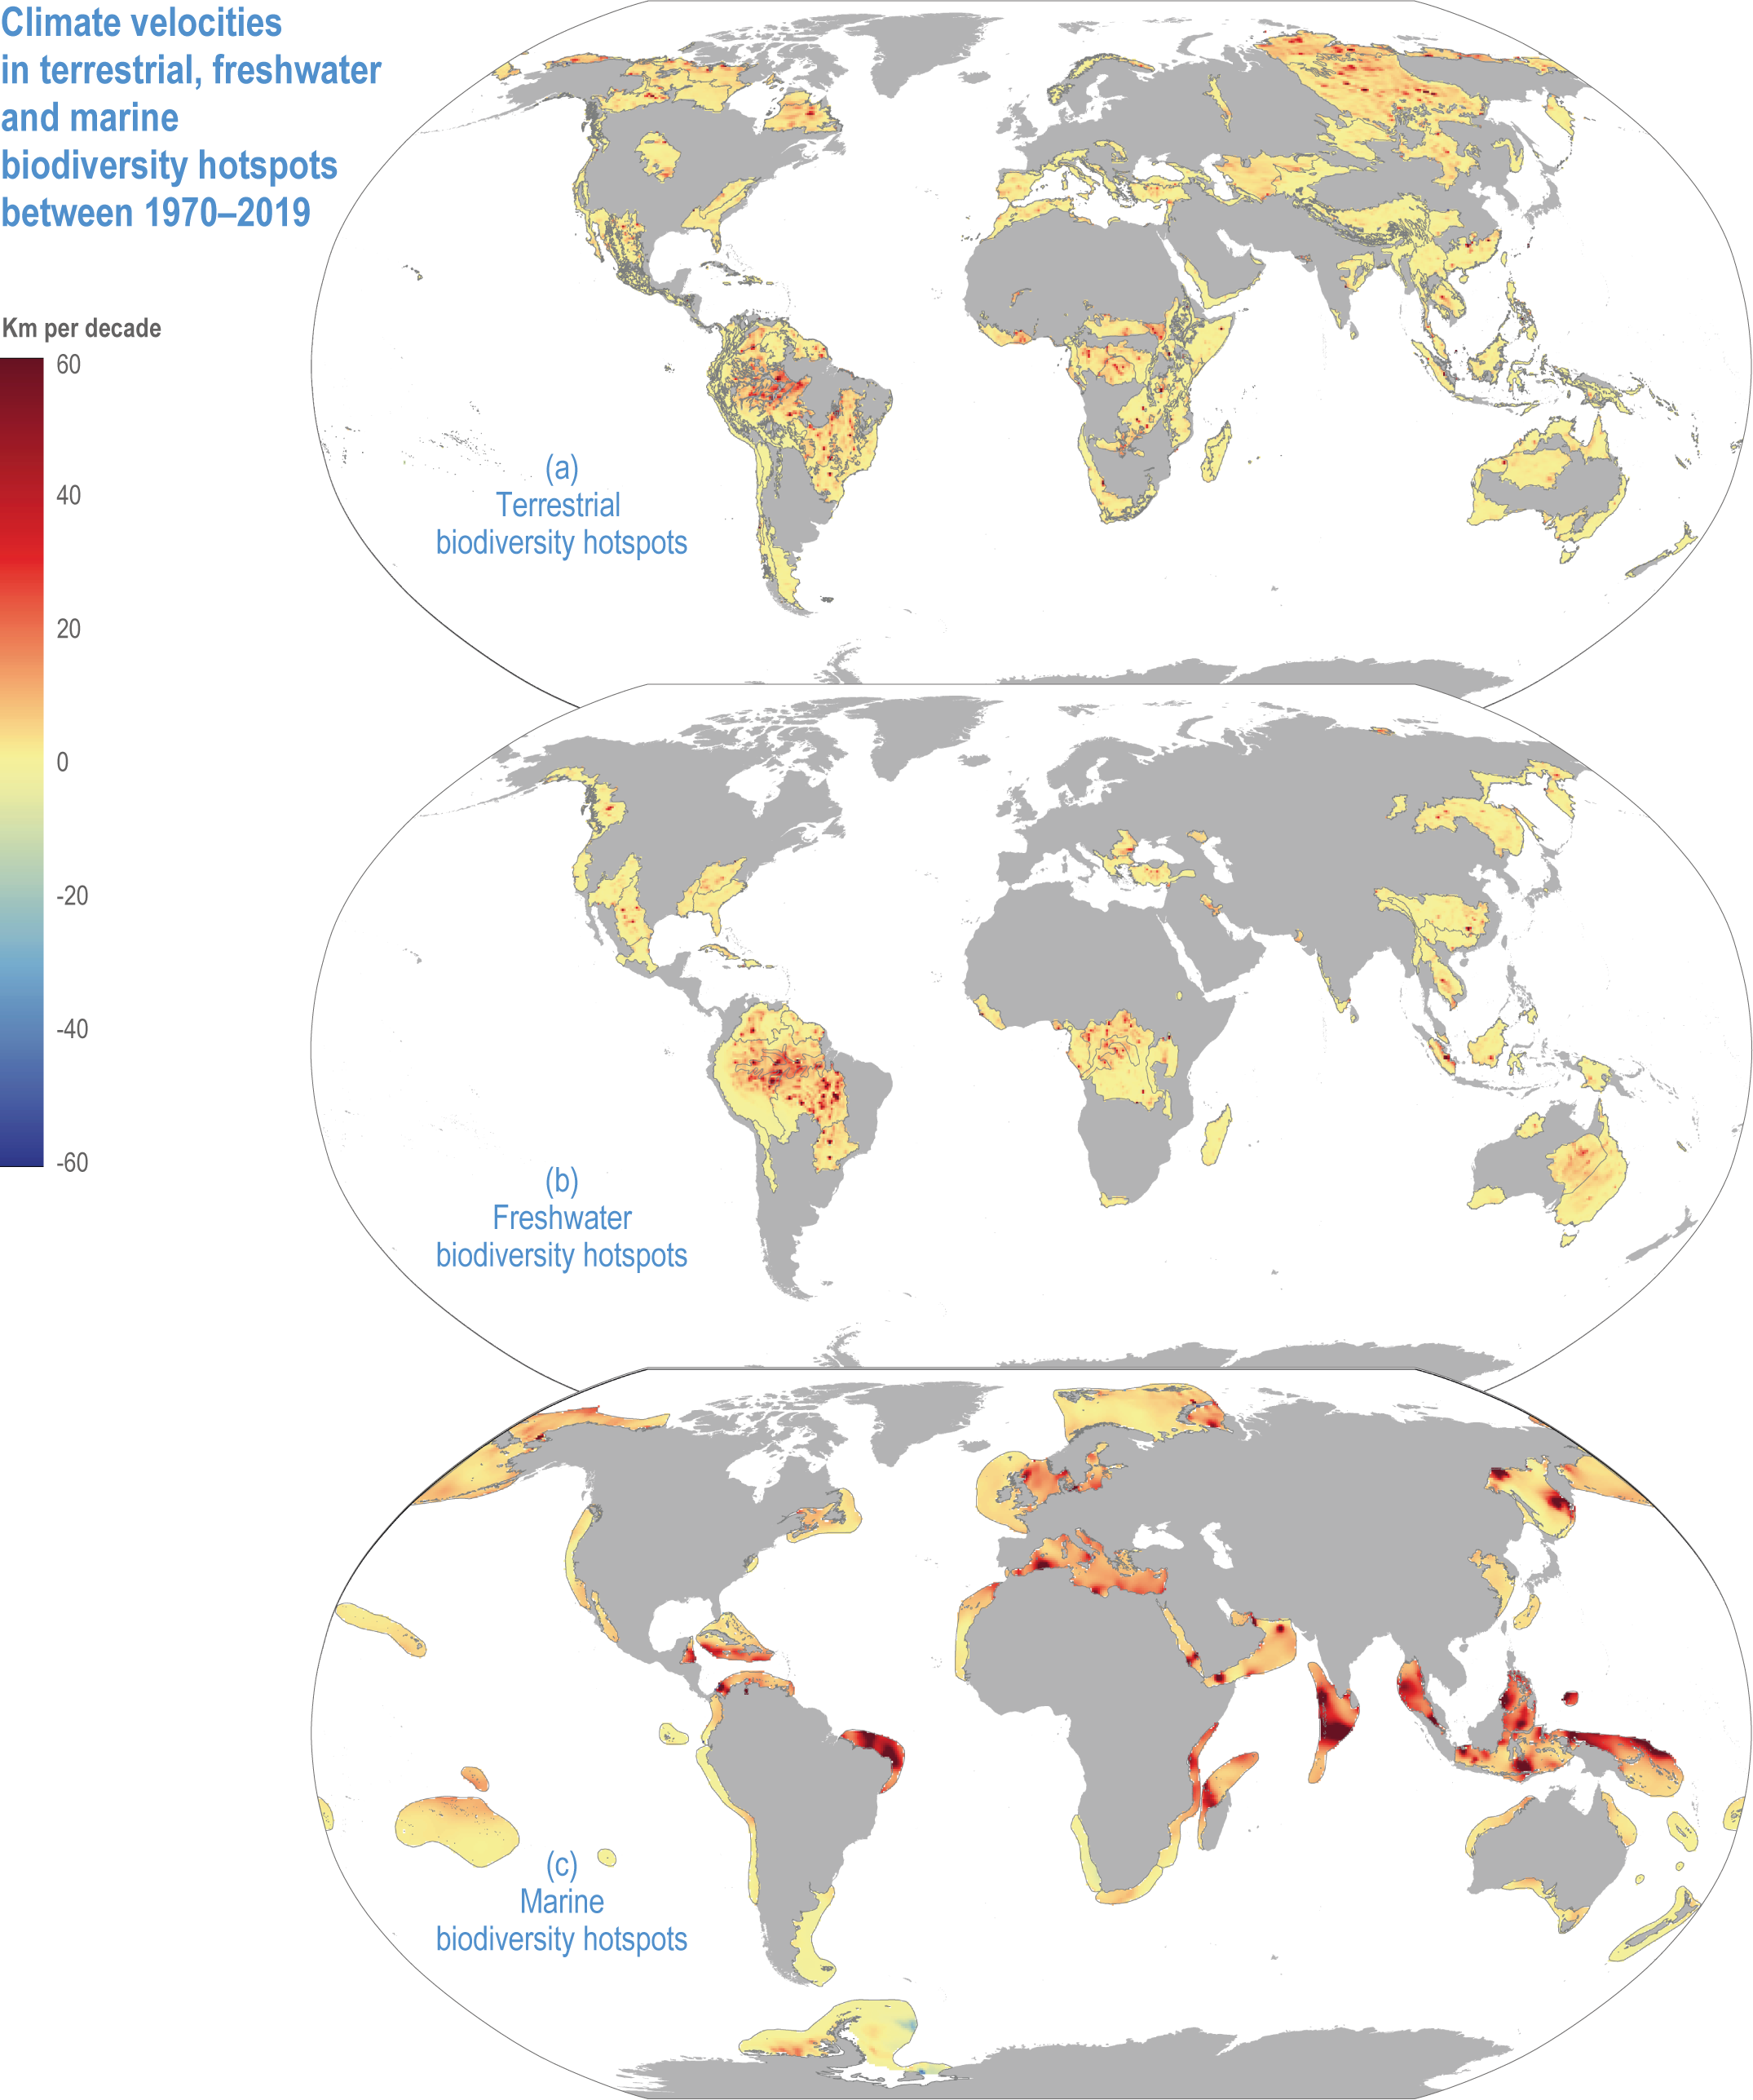
Figure CCP1.3 | Climate velocities in terrestrial (a) , freshwater (b) and marine (c) hotspots between 1970–2019. Values are presented in kilometres per decade and derived using the analytical package VoCC (García Molinos et al., 2019) from gridded temperature data, sea surface temperatures for marine (Rayner et al., 2003) and near-surface air temperatures on land and freshwater (Harris et al., 2020). Positive and negative velocities indicate warming and cooling, respectively.
Marine hotspots have a wider range of climate velocities than terrestrial and freshwater environments (Figure CCP1.3), being faster in equatorial, Mediterranean (H216), Baltic (H215), North and Okhotsk (H229), and Arctic hotspots (H196, 214), and slow in the Antarctic hotspot (H213). Marine species tend to follow climate velocities more closely than terrestrial species (high confidence) (Sunday et al., 2012; Pinsky et al., 2019; Lenoir et al., 2020). The reasons may be smaller thermal safety margins in the seas or greater human impacts on land impeding species range shifts. Climate velocities are particularly fast in equatorial seas (Figure CCP1.3; (Burrows et al., 2011), which are therefore expected to be source areas for species shifting their ranges towards the subtropics (Burrows et al., 2014). The subtropics are then source areas of species that shift to temperate latitudes and so forth, such that observed impacts in marine biodiversity hotspots are largely attributable to species range shifts (high confidence) (Pecl et al., 2017). Because marine climate velocities are significantly greater within than outside hotspots, marine hotspots are especially prone to species redistributions (medium confidence) (Figure CCP1.3; (Kocsis et al., 2021).
While species from lower latitudes may shift their geographic ranges to higher latitudes to adapt to changing climate, there are no species to replace low latitude species. Thus, as already observed in the oceans around the equator, the loss of species in low latitudes will continue with future climate warming (high confidence) (Yasuhara et al., 2020; Chaudhary et al., 2021). The issue also extends to altitudinal ranges in terrestrial environments, with species moving to higher elevations where surface area generally declines with increasing elevation; mountaintop species may have nowhere to go (Flousek et al., 2015; Freeman et al., 2018; Kidane et al., 2019).
CCP1.2.1.1.2 Observed impacts on biodiversity
Although conservation status has only been assessed globally for about 6% of all species (Costello, 2019) and most confirmed extinctions and threatened species are terrestrial, a higher proportion of freshwater species are threatened. This is reflected in the higher proportion of freshwater hotspots impacted by humans (Collen et al., 2014; Costello, 2015; Harrison et al., 2018). The rate of species endemicity is exceptionally high in freshwater biogeographic realms (i.e., large regions of distinct species composition and endemicity), at 89–96% for fish in all but one realm, compared to 11–98% for terrestrial vertebrate groups (Leroy et al., 2019) and 17–84% for marine realms (Costello et al., 2017). Already, one-third of wetlands have been lost and 9000 freshwater species are threatened with extinction without considering the effects of climate change (Darwall et al., 2018), and only 13% of world rivers were recently classified as least impacted (Su et al., 2021).
Globally, observed climate-driven changes in biodiversity are typically of species distributions shifting to higher latitudes (virtually certain) (Lenoir et al., 2020, Ch.2, Ch. 3.4). Since the 1950s, marine species richness has shifted poleward in the Northern Hemisphere, increased in mid-latitudes and declined at the equator in concert with ocean warming (medium confidence) (Chaudhary et al., 2021). Climate-driven altitudinal shifts are common on land (high confidence) (Lenoir and Svenning, 2015; Steinbauer et al., 2018), and depth shifts in the ocean may occur but are little studied (low confidence) (Burrows et al., 2019; Jorda et al., 2020). While climate-induced range expansions can be viewed as opportunities for increasing regional biodiversity, range contractions adversely affect biodiversity through regional extirpations (high confidence) (Cahill et al., 2013; Chaudhary et al., 2021).
Both of the two climate change associated global species extinctions to date support the predictions that endemic species on mountains and islands are at the greatest risk of extinction (Manes et al., 2021). The golden toad (Bufo periglenes) became extinct after some years of decline associated with changes in climate warming and precipitation in the Talamancan-Isthmian Pacific Forests biodiversity hotspot (H22) (Pounds et al., 1999; Cahill et al., 2013, WGII Ch2.4.2.2). The Bramble Cay melomys (Melomys rubicola), a rodent endemic to an island between Australia and Papua New Guinea and closely related to a mainland Australian species, became extinct due to habitat loss arising from climate change-related sea level rise and cyclone activity (Fulton, 2017; Roycroft et al., 2021, WGII Ch.11).
CCP1.2.1.2 Projected Impacts
CCP1.2.1.2.1 Projected climatic hazards
Comparison of climate warming projected for air and sea temperature shows biodiversity hotspots will continue to experience the greatest net increases in temperature at higher Northern Hemisphere latitudes, particularly in tundra regions (Figures CCP1.4; CCP1.5; Table CCP1.1). Generally, terrestrial and freshwater hotspots are projected to continue to warm more than marine (Figure CCP1.3). Modelled temperatures are projected to continue to be the highest in the tropics, indicating where there are more thermally stressful conditions for more species (high confidence) (Stuart-Smith et al., 2015; Stuart-Smith et al., 2017; Foster et al., 2018; Waldock et al., 2019). By the end of this century, all terrestrial biodiversity hotspots in Central and South America, Africa, India and southern and eastern Asia (including the Indo–West Pacific islands) are projected to experience climates unprecedented in their species’ evolutionary history (medium confidence) (Williams et al., 2007).
Based on WGIInteractive Atlas data (Gutiérrez et al., 2021), global warming is projected to affect terrestrial hotspots less than non-hotspot areas: 80% less for Myers and 95–96% less for G200 terrestrial and freshwater hotspots at global warming of 1.5°C–3°C (medium confidence) (Kocsis et al., 2021). In contrast, warming is projected to be 12–13% greater inside than outside marine hotspots (medium confidence) (Kocsis et al., 2021). Precipitation is generally projected to increase more in terrestrial and freshwater biodiversity hotspots compared to outside them (low confidence) (Kocsis et al., 2021). The exception is Myers hotspots, which are projected to have, on average, ~28% less precipitation at 1.5°C warming, but ~33% more at 2°C and ~65% more at 3°C (low confidence). However, precipitation changes are often difficult to assess as many hotspots cover large areas, with some areas projected to be wetter and some drier with wide differences between different climate models.
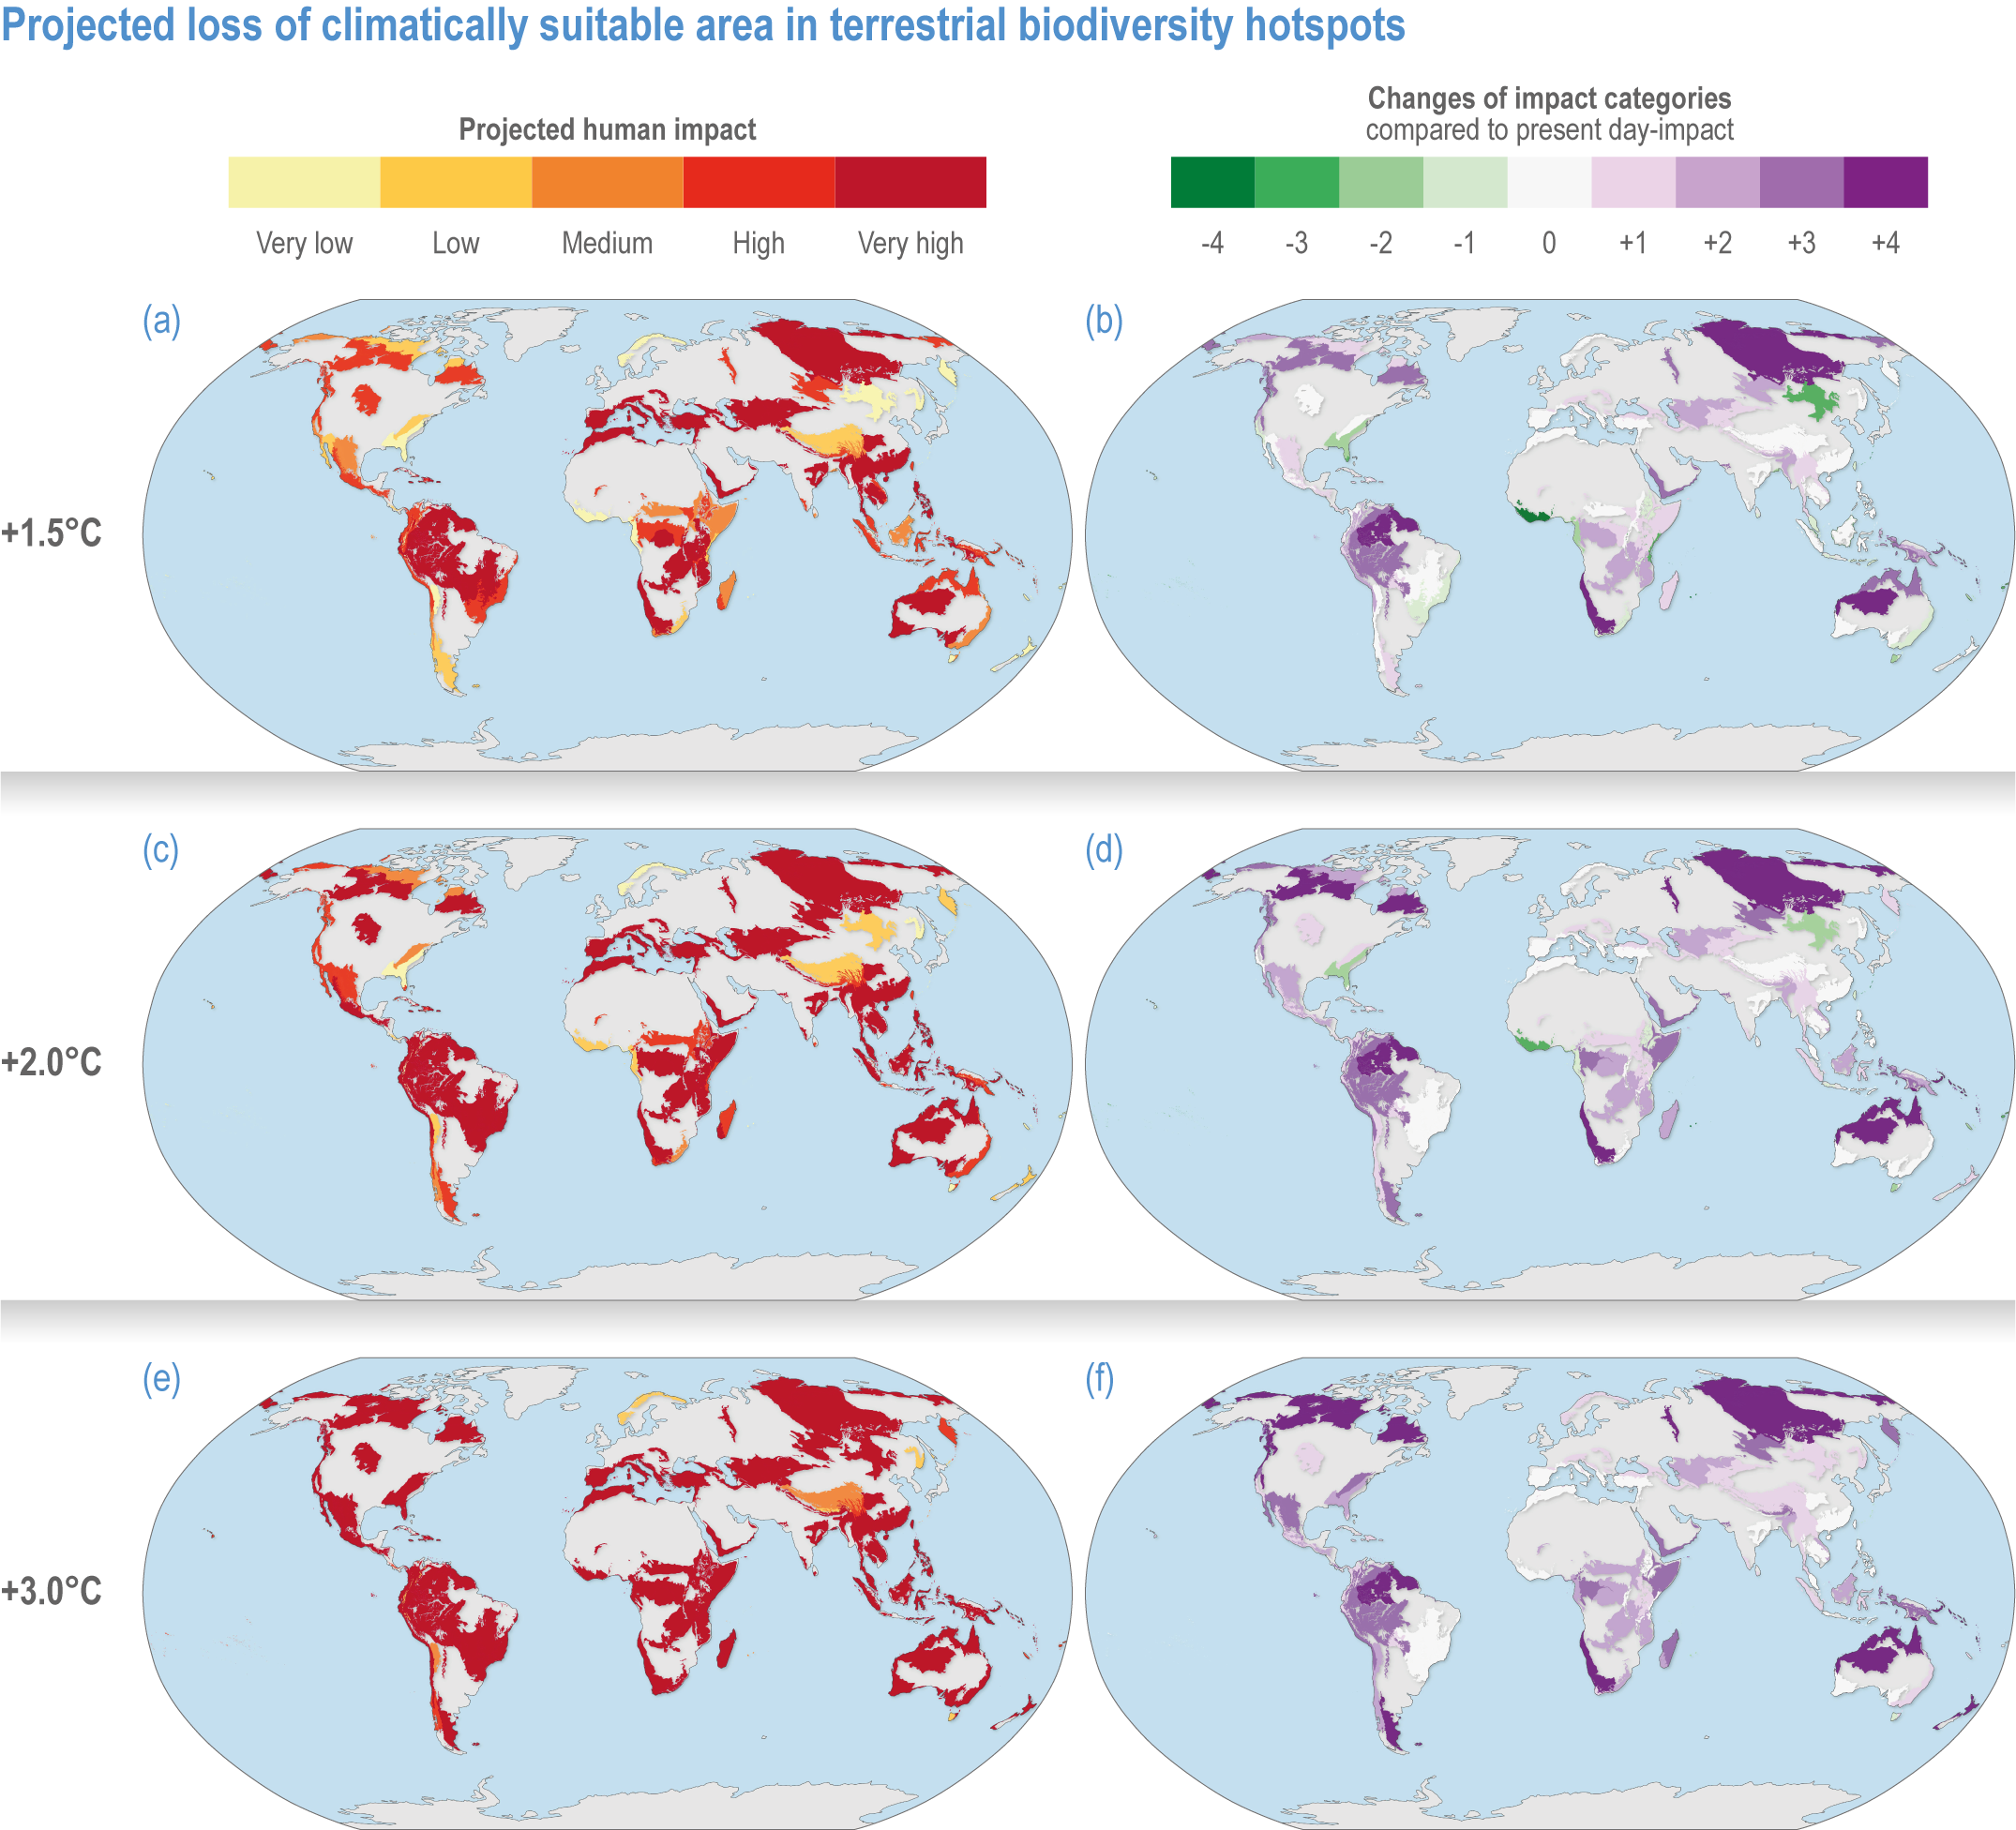
Figure CCP1.4 | Projected loss of climatically suitable area in terrestrial biodiversity hotspots for a global average of 1. 5°C (upper row, a–b), 2°C (middle, c–d) and 3°C (lower, e–f). Left-hand column displays the projected human impact using the five equal 20% categories of present-day impact (Figure CCP1.1). The right-hand column indicates the changes of impact categories compared to present-day impact. See Table SMCCP1.1 for more details.
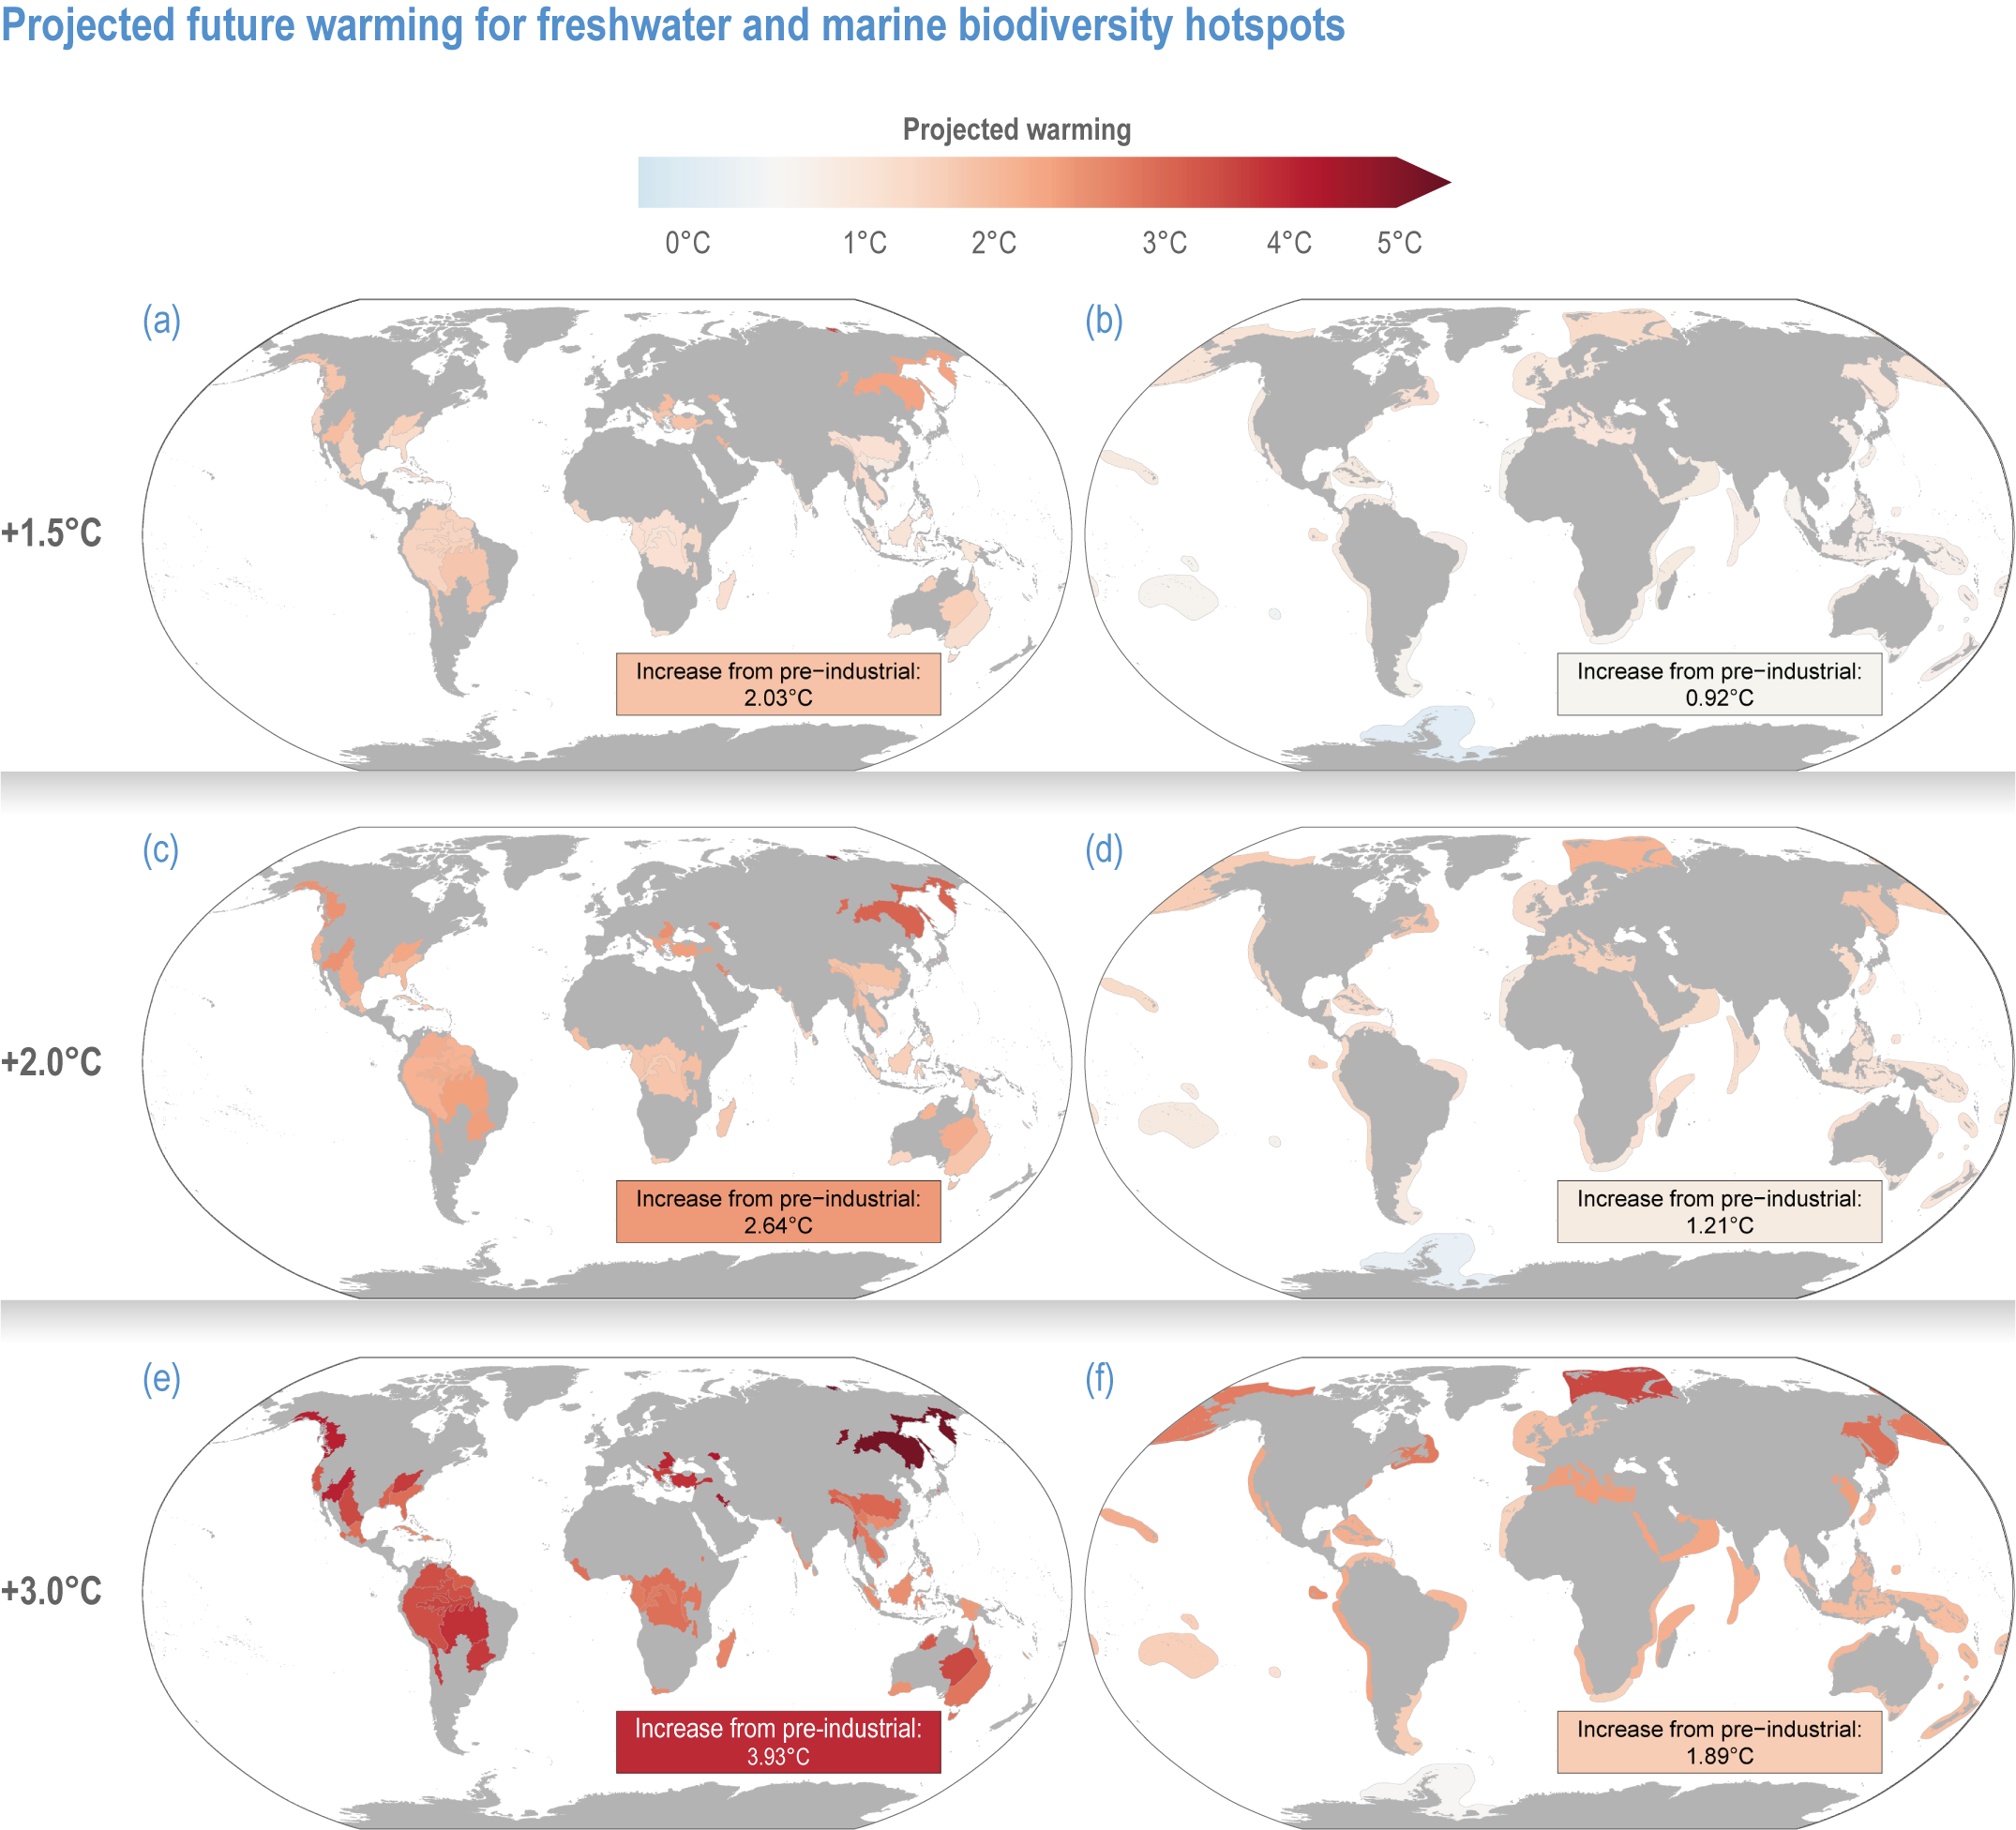
Figure CCP1.5 | Projected future warming in degrees Celsius for freshwater (left column, near-surface air temperature, panelsa, cande) and marine (right column as sea surface temperature, panelsb, dandf ) hotspots for a global average warming of +1. 5°C (a, b), +2°C (c, d) and +3°C (e, f) compared to pre-industrial conditions. Values in text boxes in the figures indicate temperature increase from present-day (2005–2014) settings. Projected temperatures were calculated with averages of multi-model, yearly means across Shared Socioeconomic Pathways (SSP) 1.26 (only for +1.5°C), SSP2-45, SSP3-70 and SSP5-85.
CCP1.2.1.2.2 Projected impacts on biodiversity
Biodiversity hotspots are expected to be especially vulnerable to climate change because their endemic species have smaller geographic ranges (high confidence) (Sandel et al., 2011; Brown et al., 2020; Manes et al., 2021). Manes et al. (2021) reviewed over 8000 projections of climate change impacts on biodiversity in 232 studies, including 6116 projections on endemic, native and introduced species in terrestrial (200 studies), freshwater (14 studies) and marine (34 studies) environments in biodiversity hotspots. Only half of the hotspots had studies on climate change impacts. All measures of biodiversity were found to be negatively impacted by projected climate change, namely, species abundance, diversity, area, physiology and fisheries catch potential (medium confidence). However, introduced species’ responses were neutral to positive (medium confidence). Land areas were projected to be more negatively affected by climate warming than marine. Land plants, insects, birds, reptiles and mammals were all projected to be negatively affected (medium confidence), as well as fish, coral reef, benthic, planktonic and other marine species (medium confidence).
Of the 6116 projections for more than 2,700 species assessed in biodiversity hotspots, ~44% were found to be at high extinction risk, and ~24% at very high extinction risk due to climate change (Manes et al., 2021) (medium confidence). Risks of extinction were estimated based on the projections for all warming levels combined, showing that endemic species were about 2.7 times more at very high risk of extinction compared to non-endemic native species (Manes et al., 2021). Extinction risks were highest for endemic species of both land and ocean (medium confidence), and were higher for those living on islands (~100%, medium confidence) and mountains (~84%, medium confidence) than in the ocean (~54%, low evidence, medium agreement ; low confidence) and on continents (~12%, robust evidence, medium agreement, medium confidence) (Figure CCP1.6). Extinction risks for non-endemic natives were ~20% for both terrestrial and marine species, with introduced species projected to become more rather than less invasive. At 1.5°C warming, ~2% of both terrestrial and marine species and at 3°C, ~20% and ~32% respectively, were projected to be at very high risk of extinction in the hotspots (Figure CCP1.6). Thus, a doubling of warming results in a roughly 10-fold increase in species at very high extinction risk.

Figure CCP1.6 | A summary of the projected risks of species extinction at global warming levels of <1. 5°C, 1.5–2.0°C and >3°C in terrestrial and marine biodiversity hotspots. Data from Manes et al. (2021).
Manes et al. (2021) found that any benefits to species (e.g., range or abundance increase) were projected to be localised and transient (e.g., Arctic, H196, 214). This and previous assessments indicate that, while climate change varies spatially and taxa may respond differently, a loss of biodiversity is projected across all terrestrial hotspots (high confidence) (Foden et al., 2013; Warren et al., 2018a; Manes et al., 2021). Abrupt changes across species assemblages may occur under all scenarios: in 9% of assemblages at 1.75°C and 35% at 4.4°C on both land and sea (Trisos et al., 2020). However, species losses may be reduced if species have thermal microclimate refugia and behavioural thermoregulation, or greater due to extreme events, such as heatwaves.
CCP1.2.1.3 Compounding and Cascading Effects
All biodiversity hotspots are already impacted, to differing degrees, by human activities (high confidence) (Table CCP1.1, Figures CCP1.1, CCP1.2, Myers et al., 2000; Le Roux et al., 2019). At present, over three billion people live within terrestrial and (catchments of) freshwater biodiversity hotspots, many of which border marine hotspots (Figures CCP1.1; CCP1.2; Table SMCCP1.1; Gutiérrez et al., 2021). Thus, climate change impacts on biodiversity hotspots are compounded by other anthropogenic impacts, increasing the vulnerability and reducing the resilience of biodiversity to climate change (very high confidence). Projections of changing climate alone may overestimate or underestimate the impacts on biodiversity (medium evidence, high agreement ). The additional risk of the combined effects of climate change and other impacts (e.g., land use change, overhunting, pollution and invasive species) on species has been raised since the Third Assessment Report. The terrestrial hotspots projected to be most affected by global warming are, in general, those already being impacted by loss of habitat due to land use change (Figure CCP1.4; Table SMCCP1.1) (Warren et al., 2018a). This remains a trend in the recent literature, although most studies still address only one stressor (Titeux et al., 2016). For example, Mantyka-Pringle et al. (2015) show that when the interaction between projected climate change and habitat loss is taken into account, the extinction risk of birds and mammals in 15–32% of terrestrial biodiversity hotspots changes. Similarly, Bellard et al. (2014b) found different results when examining the impact of climate change, invasive species and land use change independently, as opposed to synergistically. When combining those three impacts they identified the Atlantic Forest (H47), Cape Floristic Region (H65) and Polynesia-Micronesia (H1, 2, 138, 139, 142) as particularly vulnerable.
In a global assessment of the threat of climate change to river fish biodiversity, Tedesco et al. (2013) projected that current extinction rates of species may be 7% greater due to climate change. The main threat is due to the effects of drought and reduced river flows, which would be 18 times greater than without climate change. However, just 20 of the 110 river basins studied would experience sufficient climate-driven water loss to cause fish extinctions by 2090. Moreover, the present rates of species loss due to human activities are 130 times greater than those projected under future climate change (medium confidence) (Tedesco et al., 2013).
Marine systems are also vulnerable to cumulative human impacts, which can be direct (e.g., pollution, overfishing) and indirect (altered food webs) (very high confidence) (Halpern et al., 2008; Halpern et al., 2015). The marine hotspots most currently threatened by non-climate-related human impacts are all situated in the Northern Hemisphere, specifically along the northern European, Mediterranean and Asian coasts, where the overlap of overfishing and pollution is especially large (Figure CCP1.2 b; Halpern et al., 2008; Halpern et al., 2015; Ramírez et al., 2018). Although there is a strong overlap of non-climatic and climatic impacts in marine ecosystems (Blowes et al., 2019; Bowler et al., 2020), the effects suggest that climate change impacts are most severe in tropical and northern high-latitude seas (high confidence) (Doney et al., 2012; Gattuso et al., 2015; Cheung et al., 2018; IPCC, 2019b). Temperature-driven range shifts and range expansions are projected to also lead to cascading effects on marine biodiversity through ecological interactions (high confidence) (Pecl et al., 2017; Vergés et al., 2019). Cascading effects may be especially pronounced in temperate reefs, where tropicalisation could lead to the arrival of herbivorous fish and predators previously absent (Vergés et al., 2019). However, how these indirect effects of climate change on species may change food webs and ecosystem function, including carbon sequestration, is unknown. Direct and indirect human impacts due to fisheries and pollution can also lead to cascading effects that may be additive to climate impacts on biodiversity. Destruction of marine biogenic habitats due to trawling and dredging and loss of large proportions of marine megafauna, particularly fish, mammals, birds and reptiles, alter food webs and reduce resilience to additional disturbances, such as those caused by climate change (medium evidence, high agreement ) (Brander, 2007; Wernberg et al., 2011; Ramírez et al., 2017; Cheung et al., 2018; Bates et al., 2019; Costello, 2021).
The following sections report observed and projected climate change impacts on terrestrial, freshwater and marine environments.
CCP1.2.2 Terrestrial
The 177 terrestrial hotspots assessed here (including 142 G200) cover about 61,000,000 km 2 (41% of global land area), with a 37% overlap with freshwater hotspots (Table CCP1.1; Figure CCP1.2). They include wet and dry forests, woodland and scrub, highlands, mangroves, deserts, steppe, savanna, grasslands, moorlands and tundra (Figures CCP1.8-1.11). Over 77% of publications on climate change impacts on hotspots since AR5 have been on terrestrial ecosystems, most on projected (as opposed to observed) impacts (Manes et al., 2021).

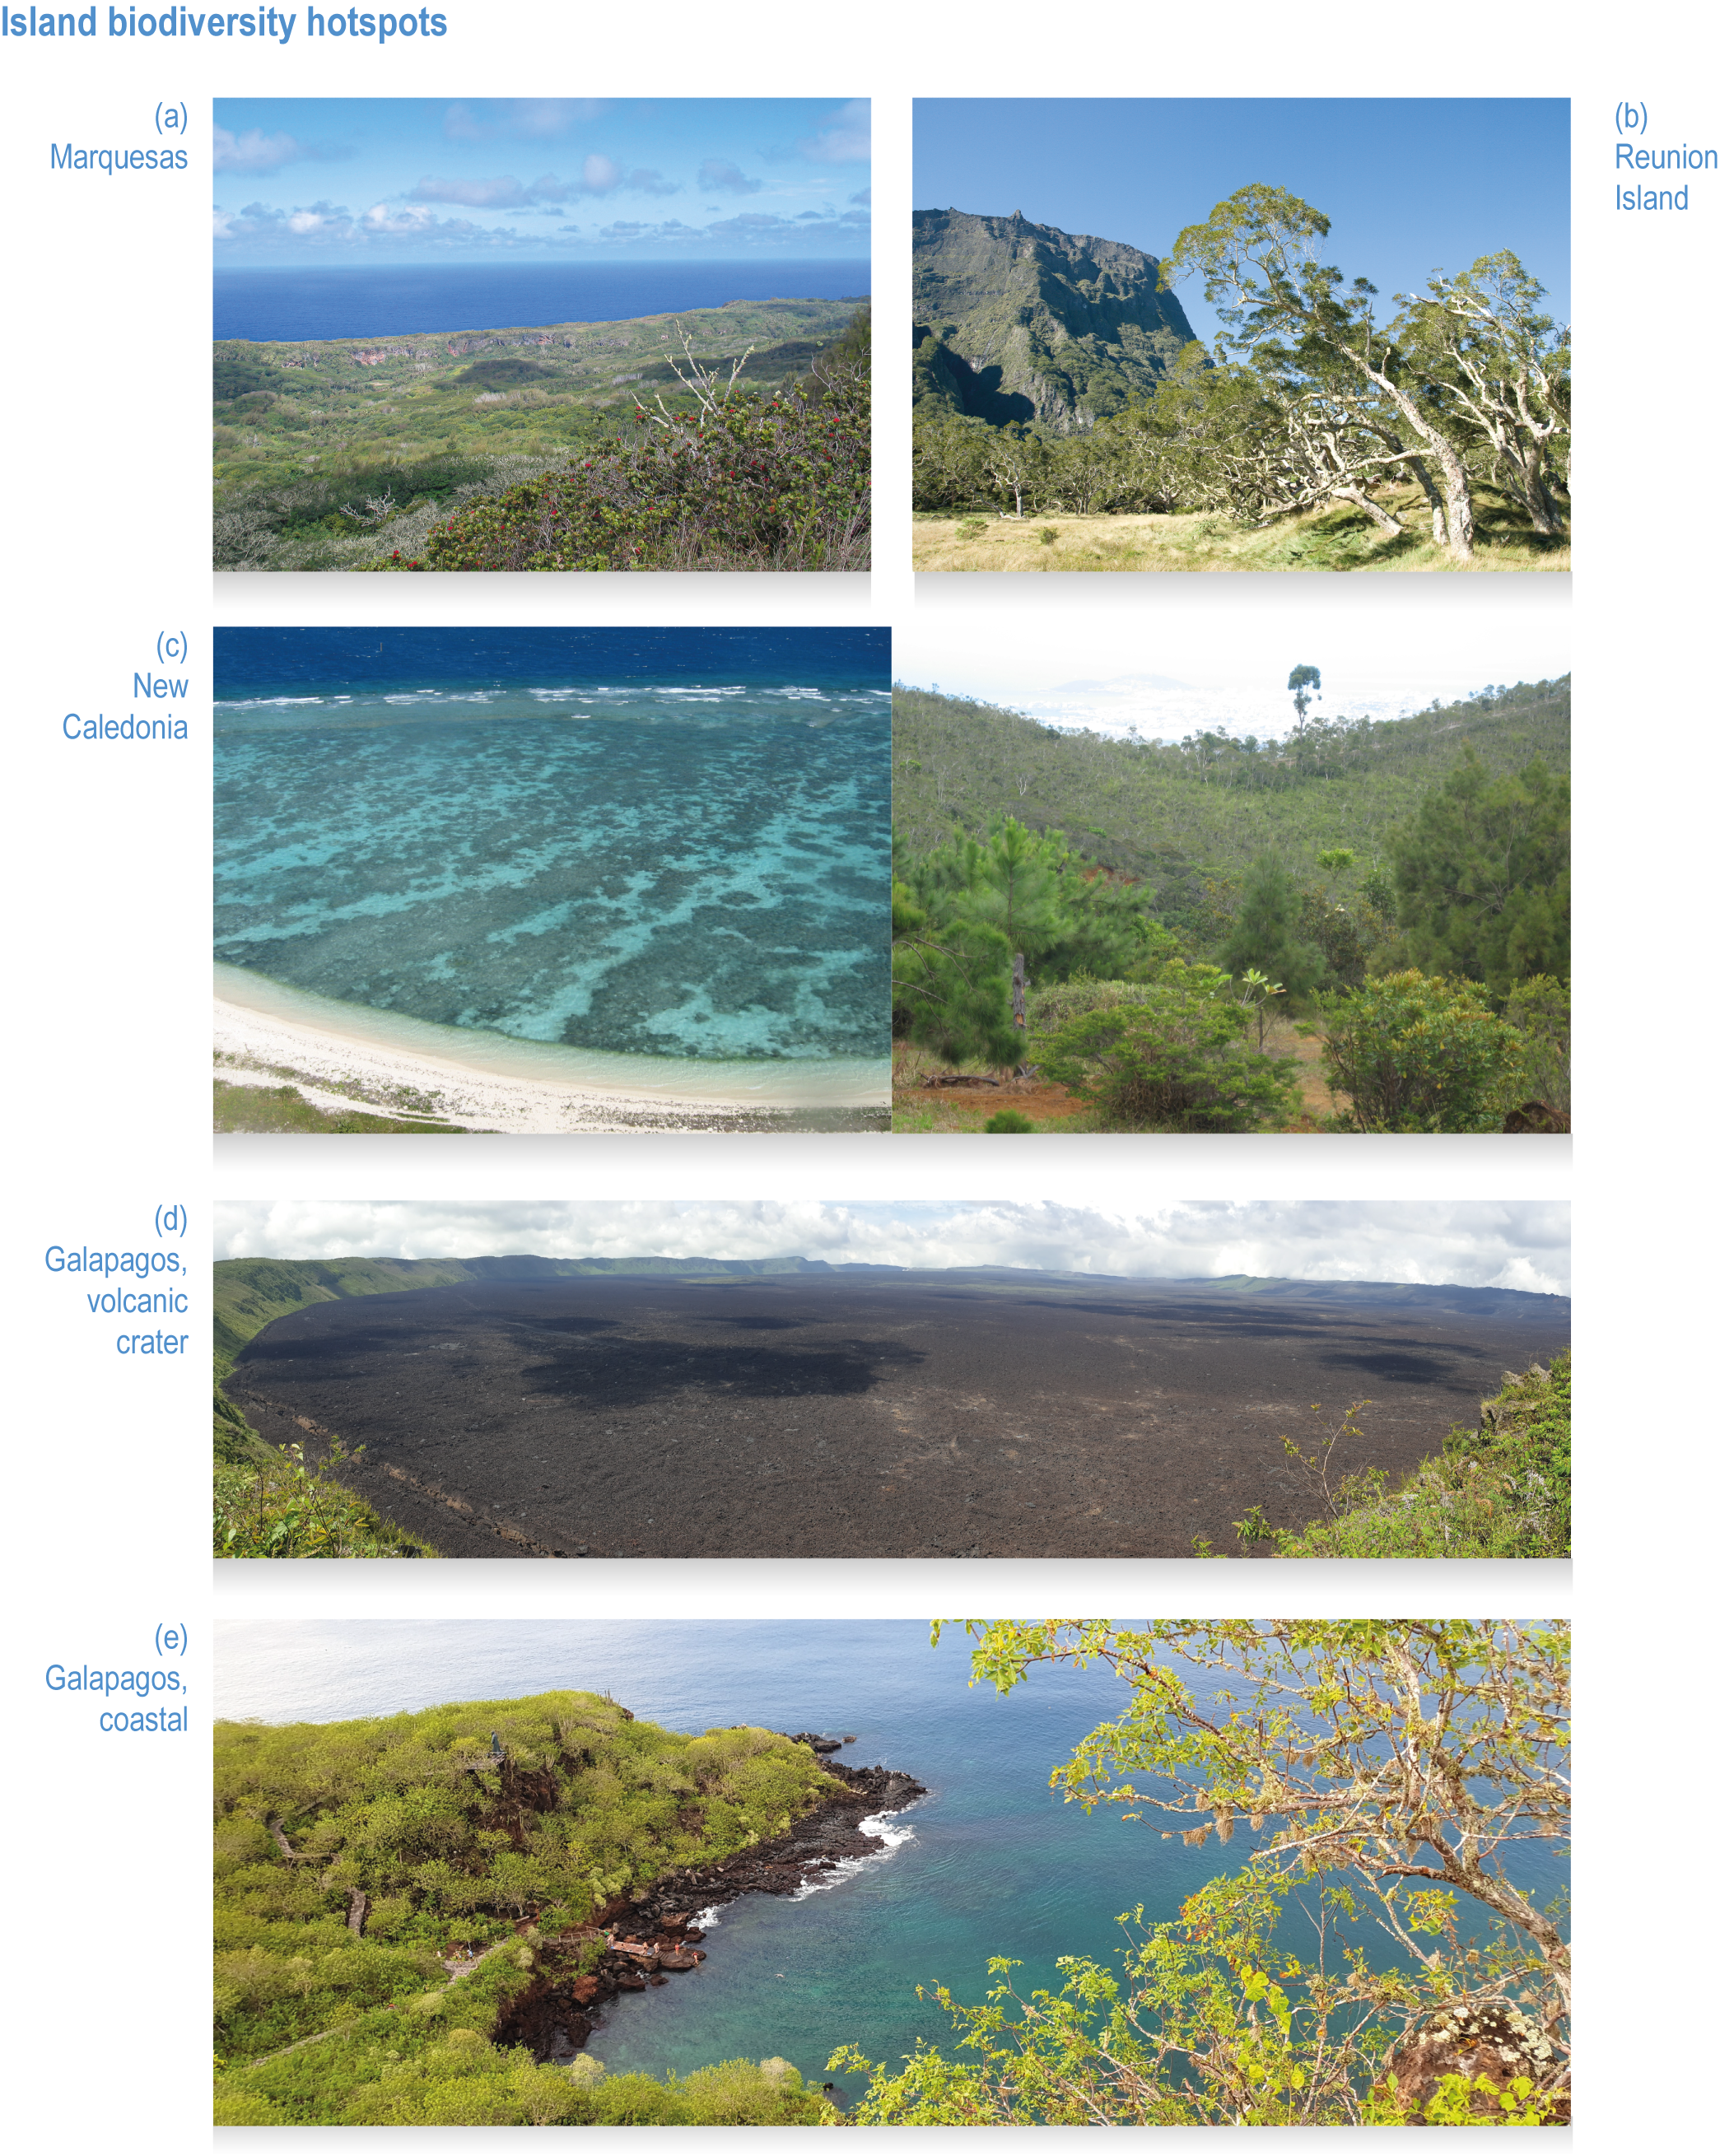
Figure CCP1.1 1 | Island biodiversity hotspots. Photos by Galice Hoarau (top two) and Mark Costello (other four).

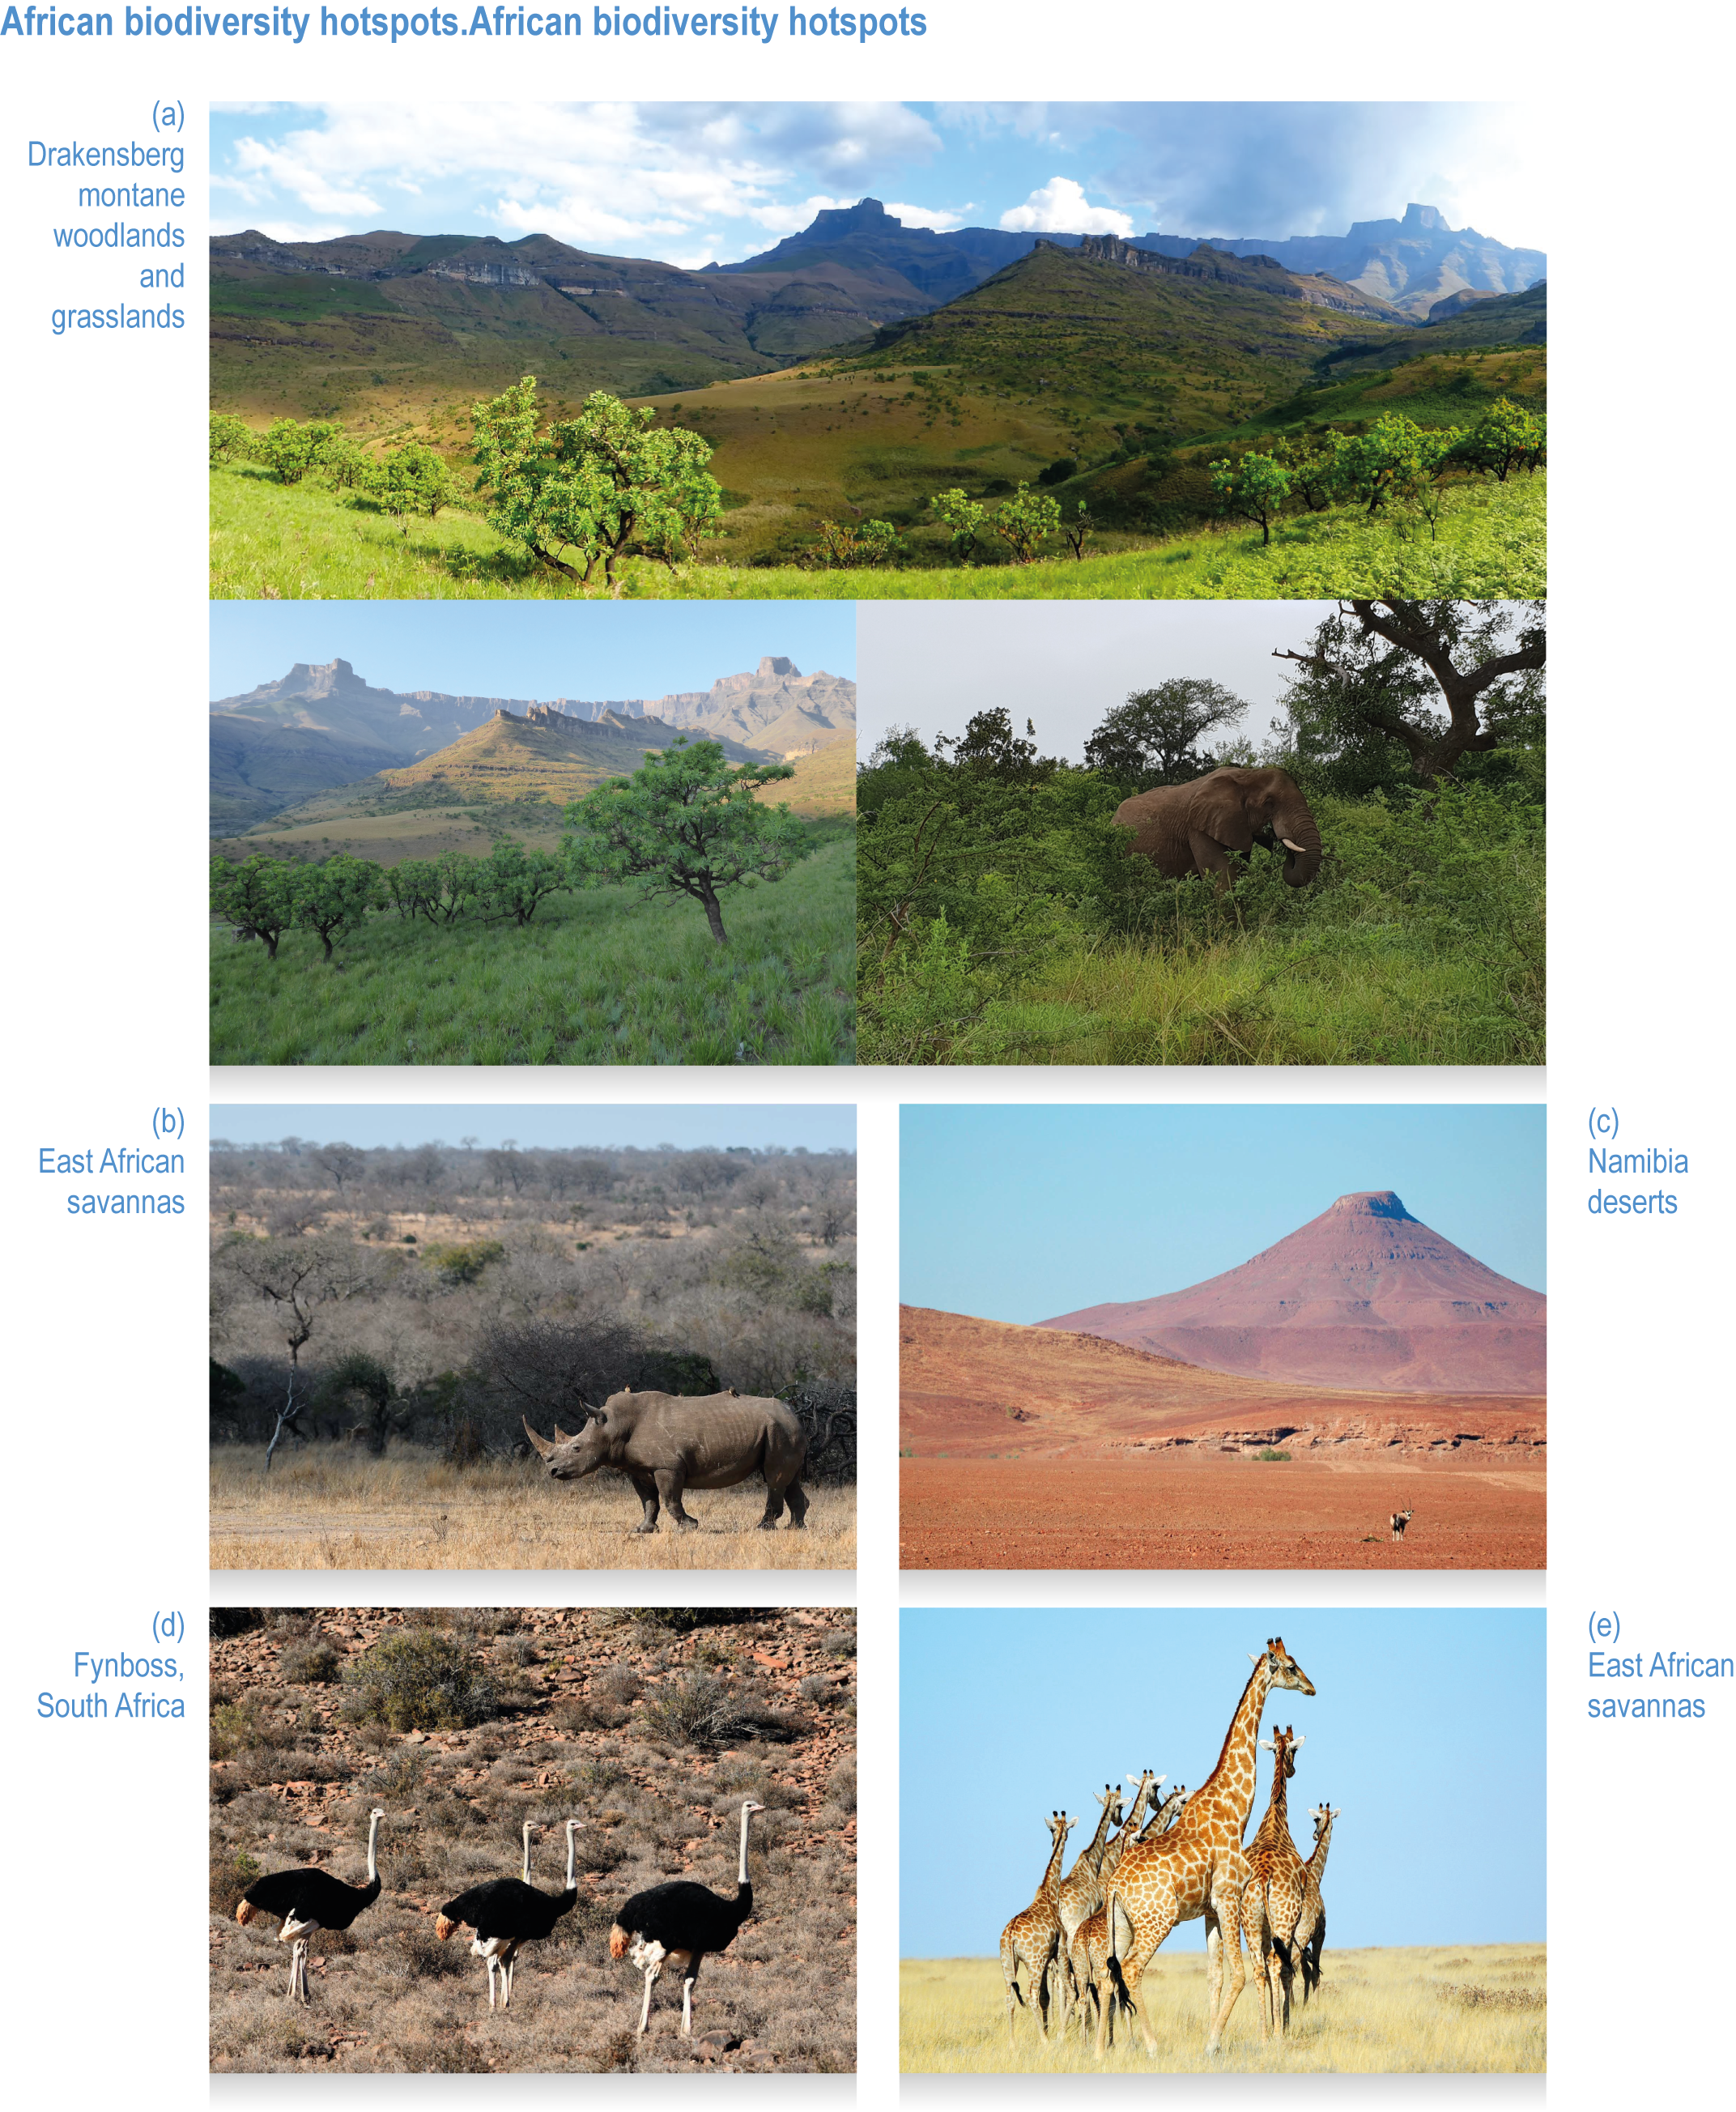
Figure CCP1.1 0 | African biodiversity hotspots. Photos by Denis Costello (top row and left second row) and Mark Costello (with elephant) for Drakensberg region, and Frank Zachos (lower four).

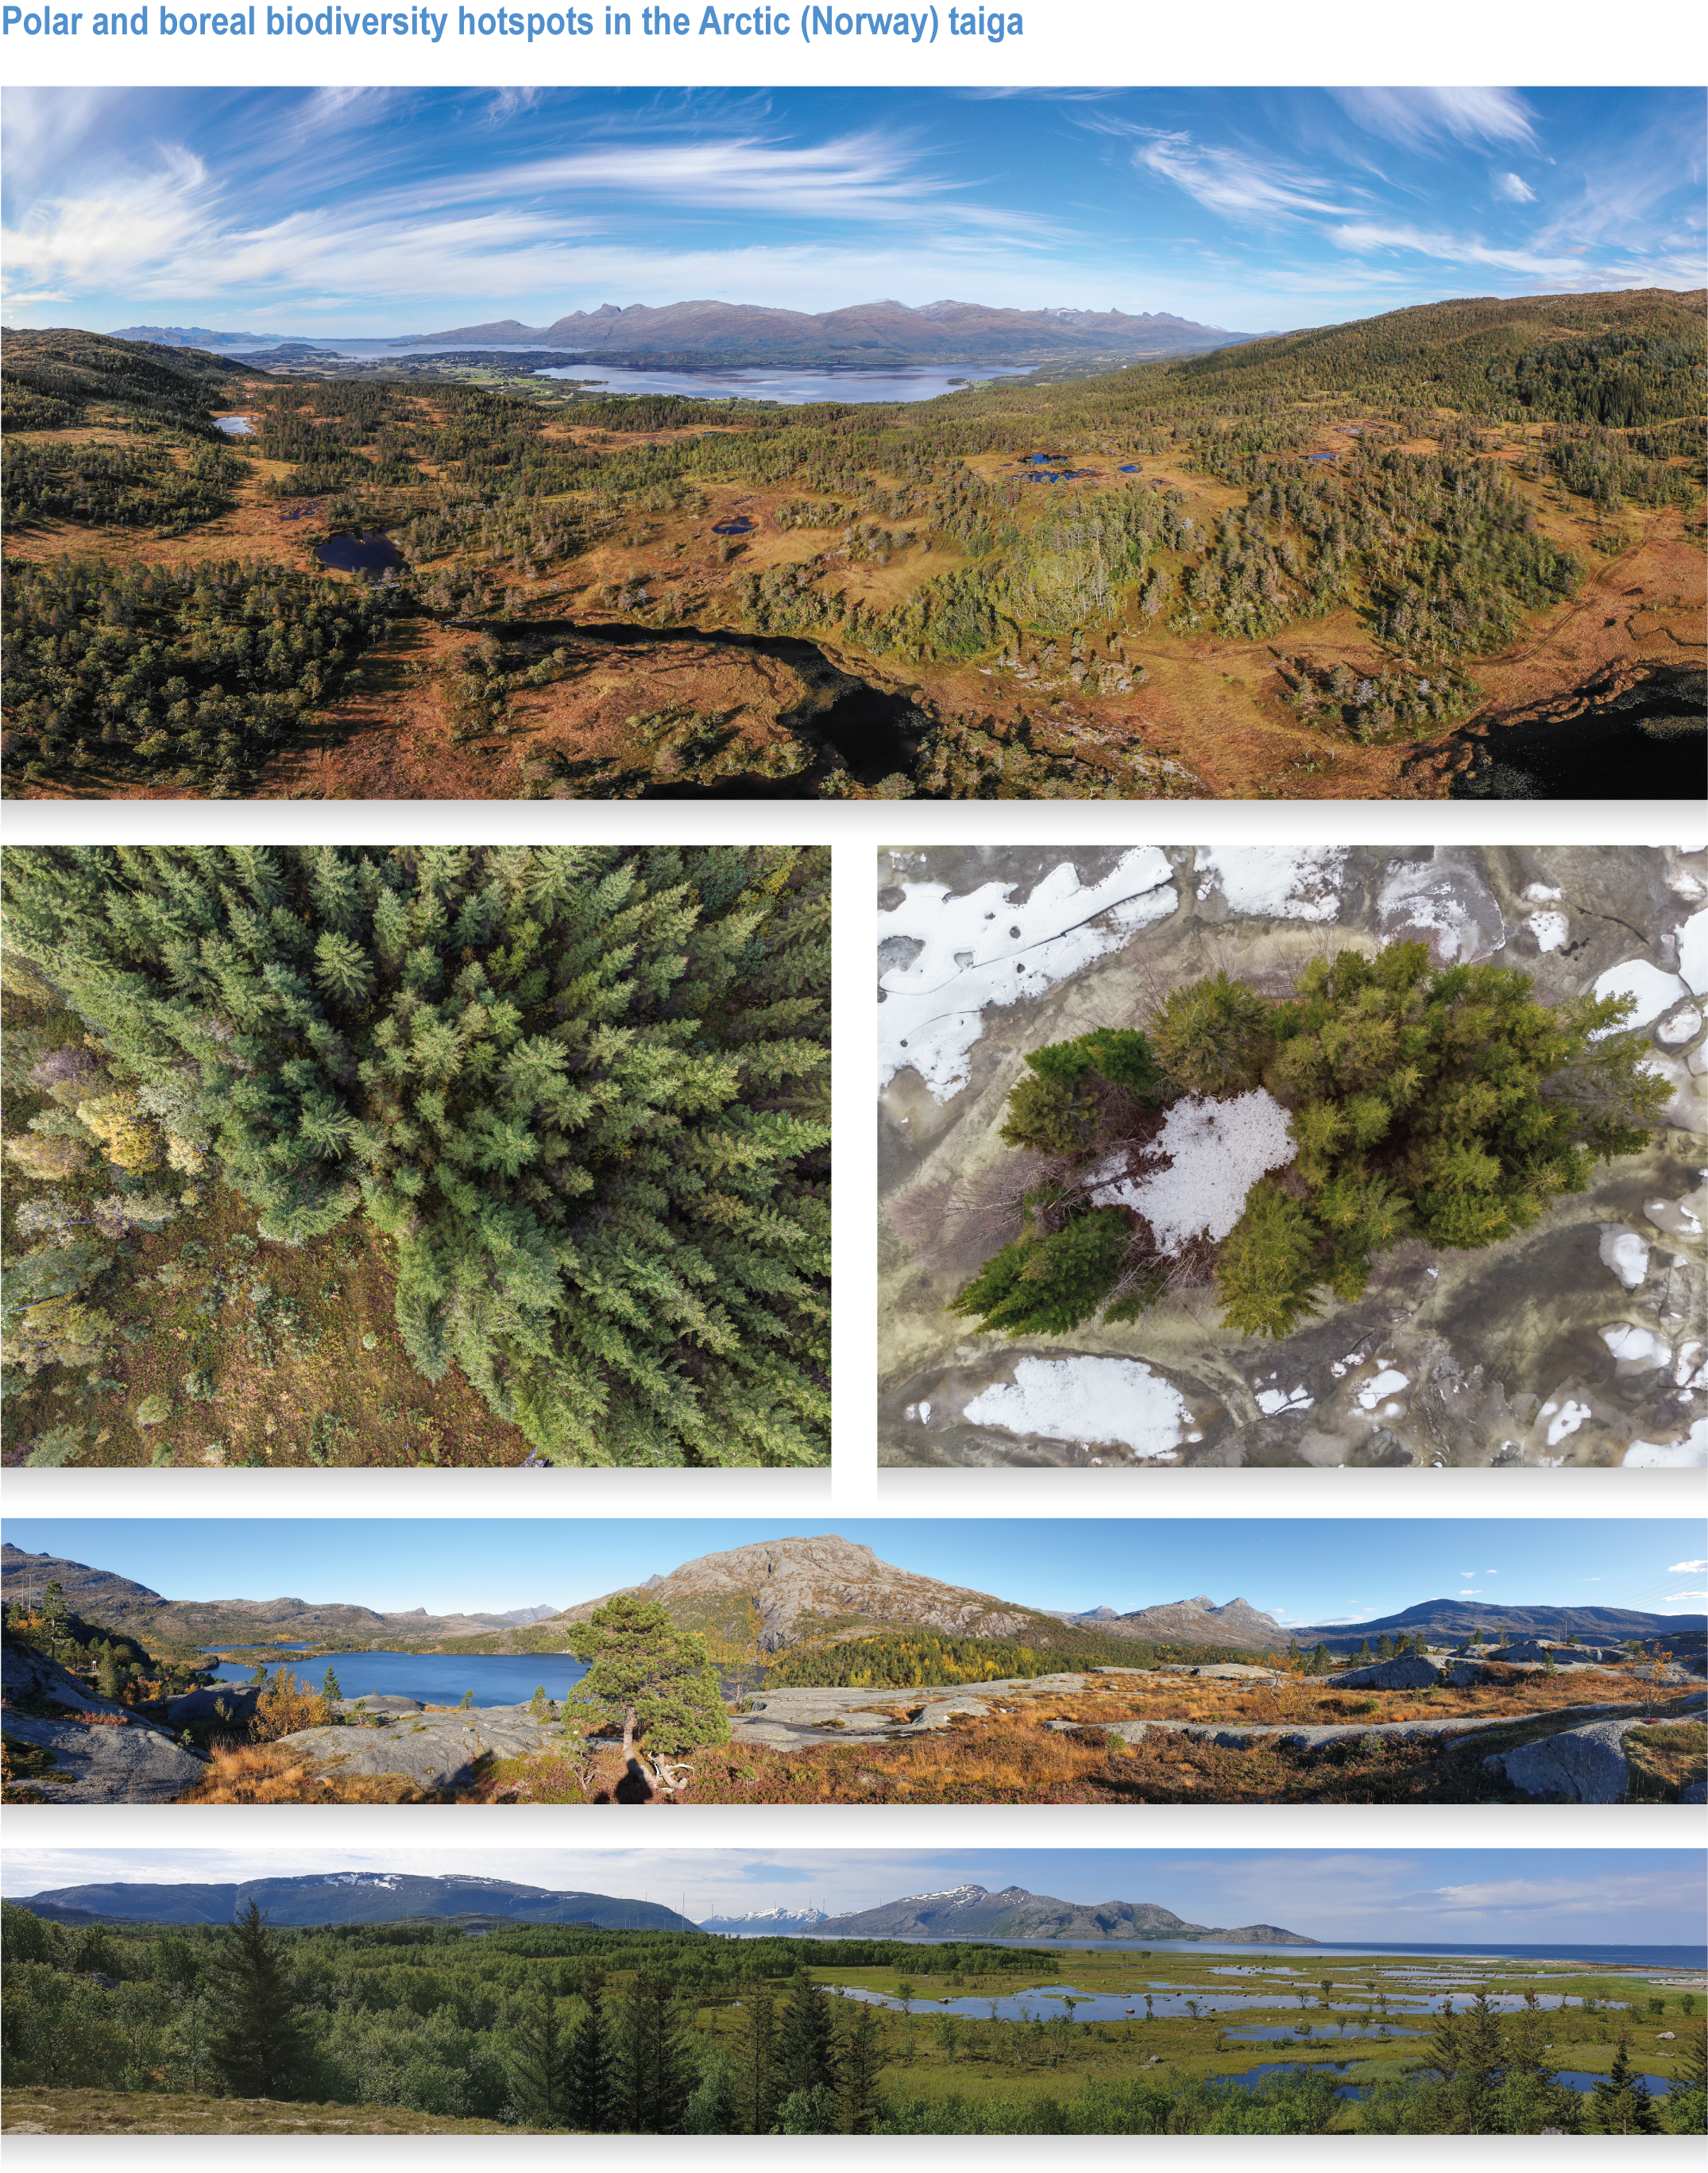
Figure CCP1.9 | Polar and boreal biodiversity hotspots in the Arctic (Norway) taiga. Photos by Galice Hoarau (top three) and Mark Costello (bottom two).

Figure CCP1.8 | Terrestrial biodiversity hotspots in the Americas, Asia and New Zealand. Photos by Denis Costello (top four), Mariana M. Vale (Brazil), and Mark Costello (other three).
CCP1.2.2.1 Observed Impacts
There is high confidence that climate change has already had impacts in North American hotspots. Phenological and range shifts have been reported for bird and mammal species within the boreal forest hotspot (Davidson et al., 2020), and earlier egg laying in birds in tundra hotspots (H3, 5) owing to changes in snowmelt (Grabowski et al., 2013). Woody vegetation is already shifting north into the tundra (Larsen et al., 2014).
In Central and South America, observed impacts within Mesoamerica (H15, 16) and the Tropical Andes hotspots (H26, 27, 28, 32, 33) comprise upward altitudinal range shifts of birds, frogs, beetles and butterflies (Narins and Meenderink, 2014; Molina-Martínez et al., 2016; Moret et al., 2016; Freeman et al., 2018) (medium confidence). A shift of the Guianan-Amazon mangroves (H37) to higher grounds inland was attributed to the effects of observed sea level rise (low confidence) (Cohen et al., 2018).
In Europe, the Mediterranean hotspot (H216) has seen increases in wildfires and droughts attributed to anthropogenic climate change (Gudmundsson et al., 2017; Barbero et al., 2020). Range shifts in birds have been observed at higher elevations (medium confidence) (Tellería, 2020).
In Africa, multiple lines of evidence suggest woody plants are increasing in area, density and cover in previously lightly wooded savanna and grassland hotspots (H65, 82) (Poulsen and Hoffman, 2015; Stevens et al., 2017). Significant vulture and cheetah range reductions in these hotspots are at least partially attributable to bush encroachment (Nghikembua et al., 2016; Wolter et al., 2016; Santangeli et al., 2018). Thus, climate-driven bush encroachment has adversely affected unique mammal and bird diversity (robust evidence, medium agreement, medium confidence). Warming and drying trends have historically been shown to reduce the range of the Ethiopian wolf (Canis simensis), and they interact with land use pressures in the Ethiopian hotspot (H68) (Sintayehu, 2018) and plant species richness in the Cape Fynbos (H65) of southern Africa to reduce post-wildfire recruitment (low confidence) (Slingsby et al., 2017).
Observed impacts in Asia were mostly restricted to the Himalaya (H95, 98, 99), Sundaland (H109, 110, 111, 112, 117, 118) and Indo-Burma (H105, 106, 107, 114, 115) hotspots, showing negative impacts through increased invasion by exotic plants, decreased suitable area for endemic species and significant changes in phenology (medium confidence) (Telwala et al., 2013; Braby et al., 2014; Padalia et al., 2015; Lamsal et al., 2017). In the Central Asian mountain landscape (H87), studies have shown increased aridity induced by climate change impacts on several shrub species (Seim et al., 2016). Some positive effects were observed for native species in terms of an increase of suitable habitat (limited evidence, low agreement ) (Priti et al., 2016; Tang et al., 2017; Rathore et al., 2019).
In Australia, climate change has been implicated in: drought-induced canopy dieback across a range of forest and woodland types due to decades of declining rainfall in the southwestern hotspot (H133); fires in the palaeo-endemic pencil pine forests (Tasmania H142); declines in vertebrates in the Australian Wet Tropics World Heritage Area, which overlaps with the eastern part of the northern Australia hotspot (H131), related to warming and increased length of the dry season; and declines in grass and increases in shrubs in the Bogong High Plains (high confidence) (Hoffmann et al., 2019). The Australian Alps have seen increased species diversity following retreat of the snow line (Slatyer, 2010), replacement of long-lived trees by short-lived shrubs following multiple wildfires (Zylstra, 2018), and changing ecological interactions due to climate-related snow loss, drought and fires (high confidence) (Hoffmann et al., 2019). While warming is allowing mangroves to expand their range in coastal hotspots of Asia and Australia (Ward et al., 2016; Hughes et al., 2019a), drought and associated salinity stress has killed mangroves in northern Australia hotspots (Babcock et al., 2019).
Approximately 76% of biodiversity hotspots within this assessment either contain, or are comprised of islands >100 km 2 (Table CCP1.1). However, just 0.08% of these hotspots were represented in post-AR5 literature examining climate change impacts on terrestrial biodiversity. Most observed impacts were assessed with low evidence, but high agreement , and focused on plants and insects. Impacts described included abundance changes and extirpations (Jenouvrier et al., 2014), altitudinal range shifts (Koide et al., 2017), increased invasive alien species’ abundance and extent in Madagascar (H76, 77), Balearic (H51) and Pacific islands (Ghulam, 2014; Silva-Rocha et al., 2015; Goulding et al., 2016; Dawson et al., 2017), increased temperature affecting physiology, body size and behaviour of frogs in the Caribbean (H20) (Narins and Meenderink, 2014) and phenological alterations (Fontúrbel et al., 2018). One positive observation was the high resilience to recovery of intact forest ecosystems to tropical cyclones within Caribbean (H20) and Pacific islands (medium confidence) (Keppel et al., 2014; Marler, 2014; Shiels et al., 2014).
CCP1.2.2.2 Projected Impacts
Most terrestrial species in biodiversity hotspots in North America have been projected to be negatively impacted by climate change (medium evidence, medium agreement , medium confidence). About ~80% of projections for assessed species showed a negative impact of climate change, with ~25% at very high risk of extinction (Figure CCP1.7; Manes et al., 2021). Alterations to vegetation that would have ecosystem-wide impacts, such as a shift from oak-dominated forests to predominantly hickory and maple species in the Appalachian Forests (H17) (Ma et al., 2016) or the continued shrinking of tundra ecosystems, have also been projected. Range shifts have been projected for a variety of plants (Beltrán et al., 2014; Riordan and Rundel, 2014) and vertebrate taxa (Warren et al., 2014; Stralberg et al., 2015; McKelvy and Burbrink, 2017). Sizeable range loss, which particularly affects endemic species, is projected with higher levels of climate change. Adaptation in the agricultural sector poses an additional risk to remaining wildlife habitat (e.g., wine in California: Roehrdanz and Hannah, 2016).
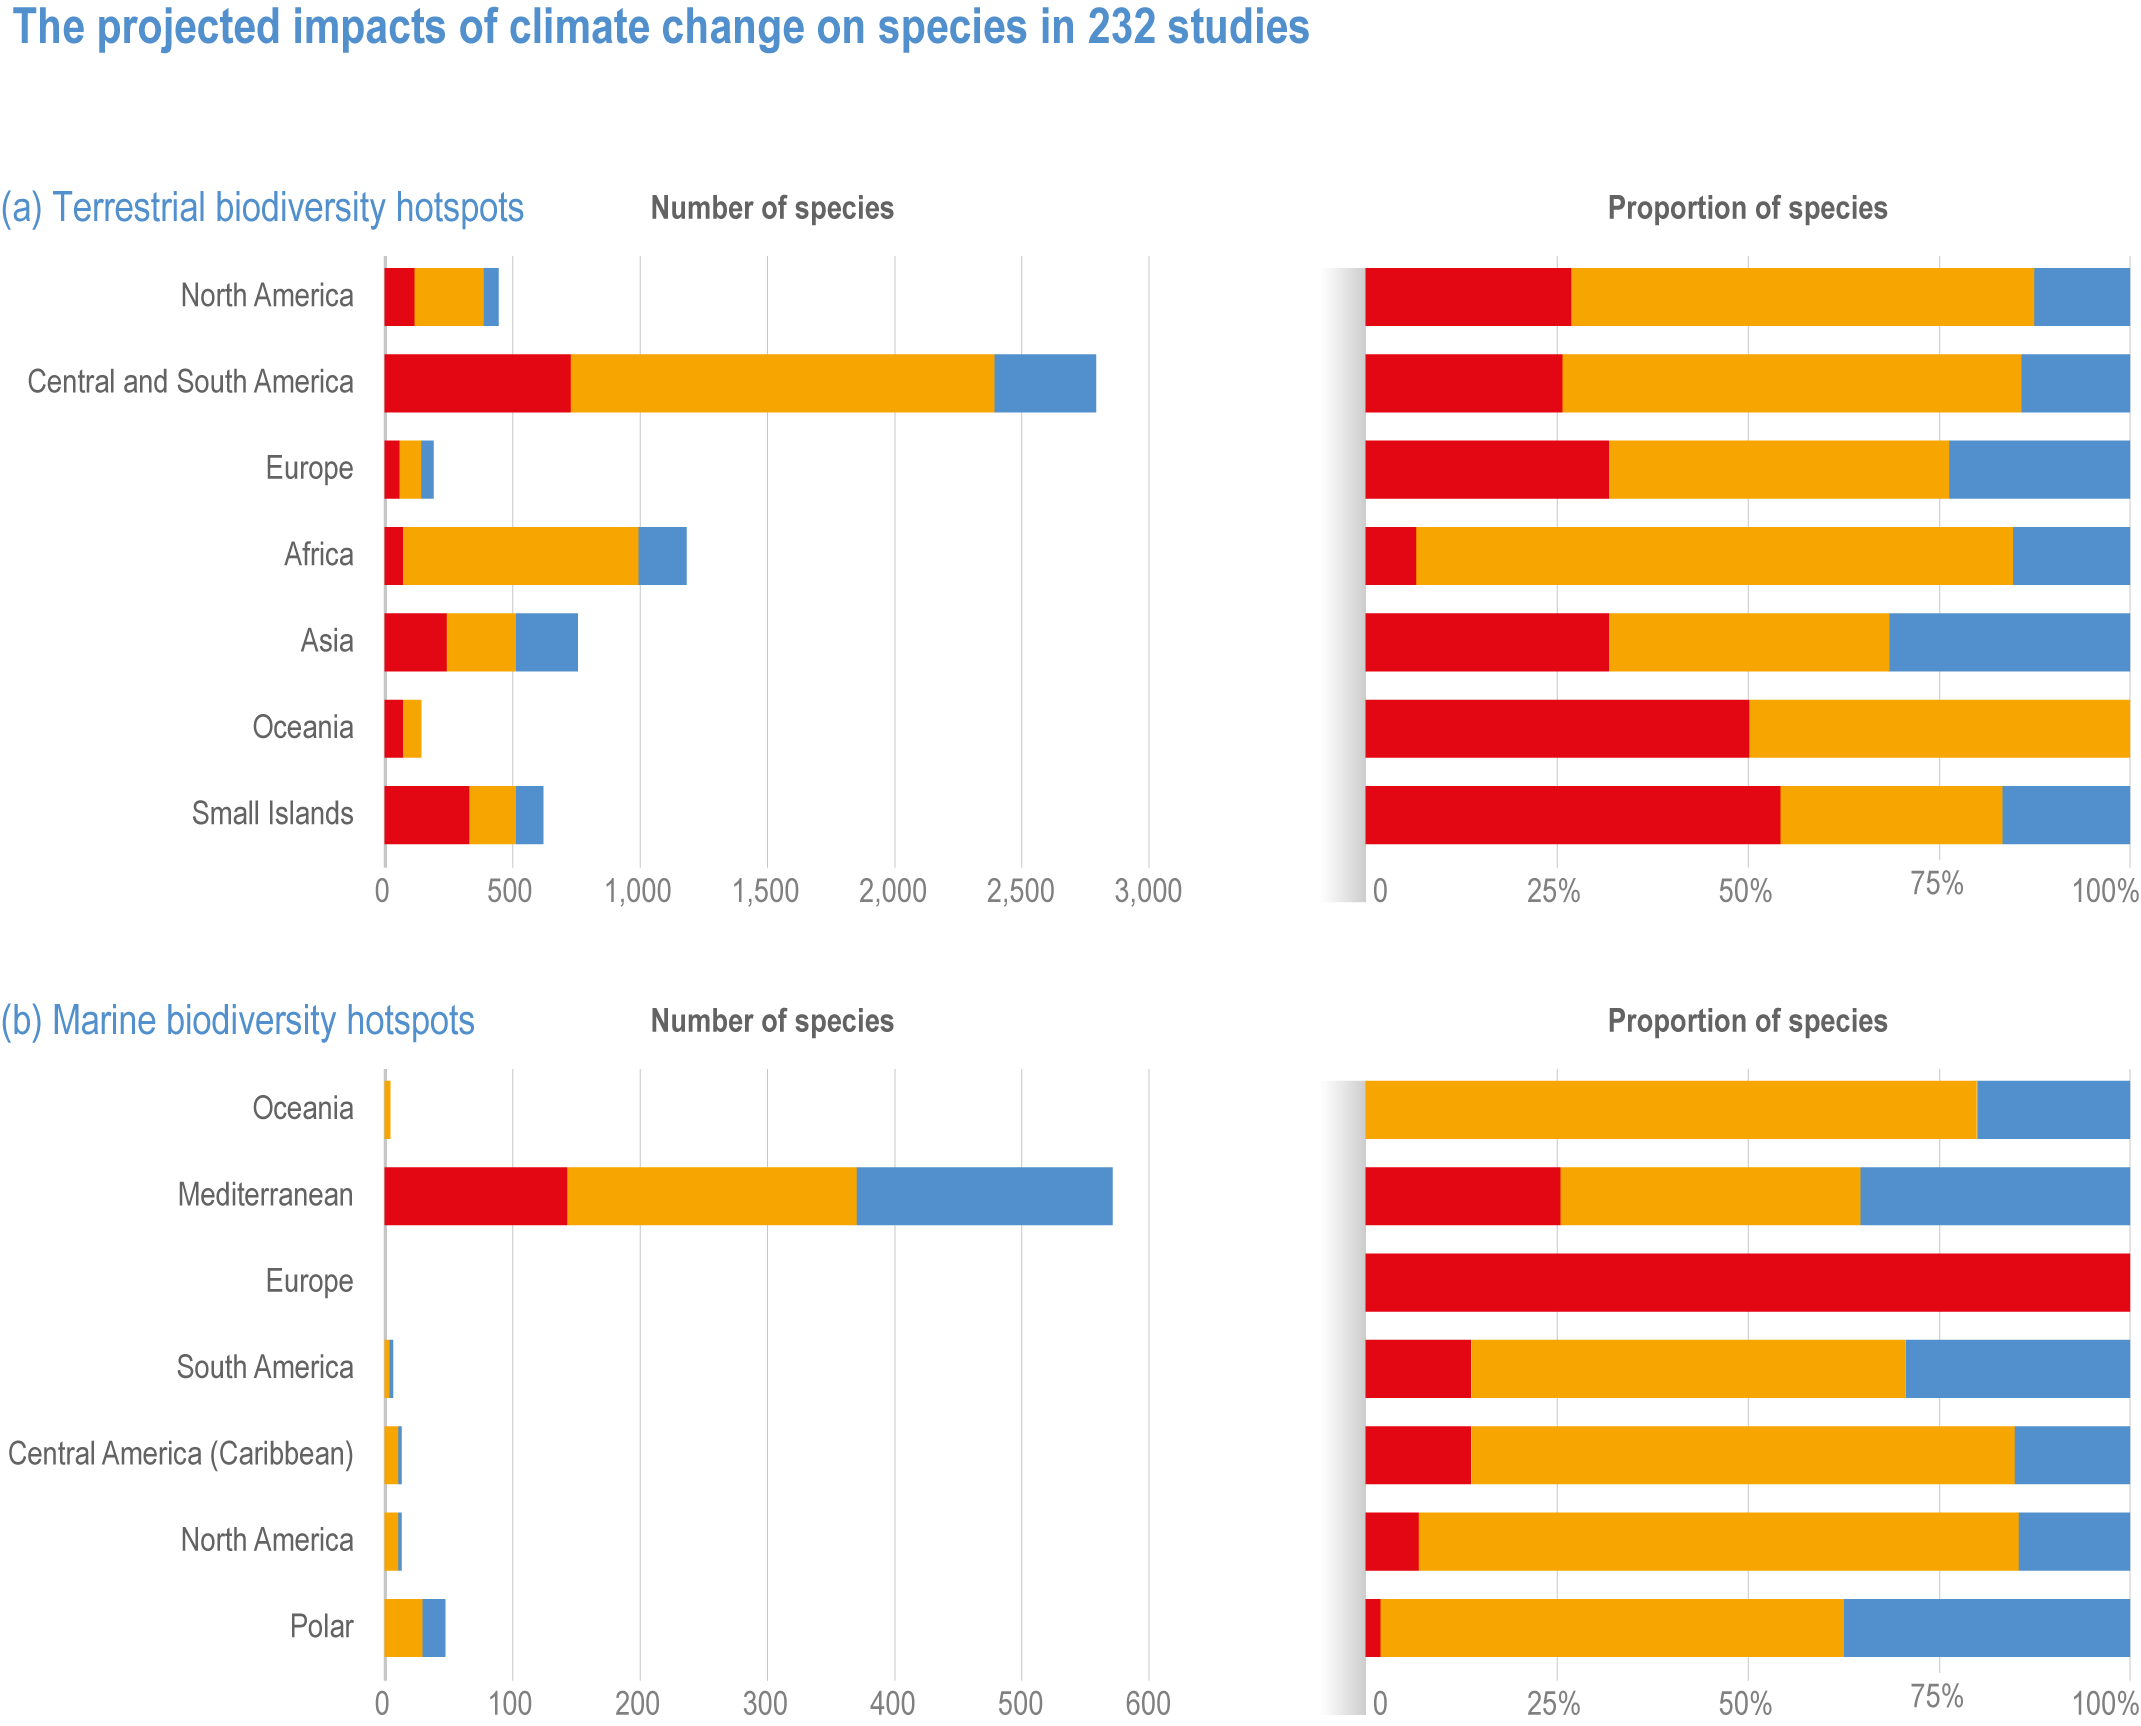
Figure CCP1.7 | The projected impacts of climate change on species in 232 studies (a) terrestrial and (b) marine hotspots (adapted from Manes et al. , 2021), illustrating the number and percentage of species showing positive (blue) and negative (orange) responses to climate change, and threatened with extinction (red). Note Oceania includes Australia, New Zealand, Wallacea, New Guinea, New Caledonia, Polynesia and Micronesia and overlaps the global Small Islands category, which excludes Australia. The Small Islands category represents oceanic and continent-associated small islands, and thus overlaps with Oceania and continental data.
In Central and South America, risks have been assessed in at least 24 terrestrial hotspots, especially within the Atlantic Forest, Cerrado, Mesoamerica and the Caribbean, the most studied hotspots in the world in terms of climate change impacts (H47, 44, 15, 16, 20, respectively) (Manes et al., 2021). About 85% of projections for assessed species showed a negative impact of climate change (high confidence), with ~26% projecting species extinctions (Figure CCP1.7; Manes et al., 2021). Projected impacts include contraction or loss of species’ geographic range, loss of diversity and high species turnover (high confidence). Most studies had focused on vertebrates and plants in the Atlantic Forest (H47) and Cerrado (H44) (Loyola et al., 2014; de Oliveira et al., 2015; Vale et al., 2018; Vasconcelos et al., 2018; Hidasi-Neto et al., 2019; Lima et al., 2019; Lourenço-de-Moraes et al., 2019; Vasconcelos and Prado, 2019; Velazco et al., 2019). Several insect species are projected to lose suitable climatic conditions, including moths in Cerrado (H44) (Khormi and Kumar, 2014). There were projected negative impacts on vegetation such as rupestrian grasslands in Cerrado (H44) (Fernandes et al., 2018) and tropical and temperate forests in Mesoamerica (H15, H16) (Mendoza-Ponce et al., 2018; Mendoza-Ponce et al., 2019). Endemic species face consistent risks of decrease in suitable habitat in the Atlantic Forest (H47) (Vale et al., 2018), Cerrado (H44) (Vasconcelos, 2014), Tumbes-Chocó-Magdalena (H28, H23) (Hermes et al., 2018), and Mesoamerica (H15, H16) (Garcia et al., 2014; Ramírez-Amezcua et al., 2016). Climate change may also benefit invasive plant species in terms of range expansion (Wang et al., 2017) and physiology (de Faria et al., 2018) in the region.
In European biodiversity hotspots, about 75% of projections for assessed species showed a negative impact of climate change, with ~30% at very high risk of extinction (medium confidence) (Figure CCP1.7; Manes et al., 2021). These threats are projected to be worse under higher levels of warming. Increased wildfire size and frequency is projected to have a strong effect on the Mediterranean basin (H216) ecosystems (medium confidence) (Lozano et al., 2017). Range reductions have been projected for endemic plants (Pérez-García et al., 2013; Casazza et al., 2014), reptiles (Ahmadi et al., 2019), birds (Abolafya et al., 2013) and insects (Sánchez-Guillén et al., 2013) (medium confidence).
In African biodiversity hotspots, about 80% of projections for assessed species showed a negative impact of climate change, with ~10% at very high risk of extinction, especially of endemic species including birds, plants, bees across several taxa and hotspots if warming exceeds 2°C (high confidence) (Figure CCP1.7; Huntley and Barnard, 2012; Kuhlmann et al., 2012; Baker et al., 2015; Lee and Barnard, 2016; Young et al., 2016; Hannah et al., 2020; Manes et al., 2021).
In Asia, there is a bias in studies towards Indo-Burma (H105, 106, 107, 114, 115), followed by Himalaya (H95, 98, 99) and Southeast Asian montane tropical and temperate forests. About ~70% of projections for assessed species showed a negative impact of climate change, with ~30% at very high risk of extinction (medium confidence) (Figure CCP1.7; Manes et al., 2021). Impacts include species’ range changes, habitat loss for endemic plants, expansion of invasive species, decreased connectivity and overall species richness decline (high confidence) (DasGupta and Shaw, 2013; Telwala et al., 2013; Sridhar et al., 2014; Zomer et al., 2014; Ali and Begum, 2015; Aryal et al., 2016). A projected decrease in habitat suitability for large species like the Asiatic black bear (Ursus thibetanus) is of concern as alternative habitats are outside protected areas, and may lead to human–wildlife conflicts (Farashi and Erfani, 2018). The few positive impacts of climate change were projected as increases in suitable habitat and distribution range for a few endangered plants and mammals (medium confidence) (Banag et al., 2015; Shrestha et al., 2018). Animals benefiting from increased fruit and seed production in Southeast Asian forests during warm El Niño cycles were also projected to increase with climate warming (Corlett, 2011).
All projections for assessed species in Australia and New Zealand terrestrial biodiversity hotspots showed a negative impact of climate change, with half at very high risk of extinction (low confidence) (Manes et al., 2021). Observed impacts in the Australian Alps were projected to continue under future climate change (Zylstra, 2018). The northern Australia savanna (H131) may experience increased rainfall and carbon dioxide due to climate change (Scheiter et al., 2015), and the range of exotic grasses was projected to be reduced under climate warming (Gallagher et al., 2009). In Australian tropical wet forests, ground-living vertebrates may be more sensitive than arboreal species to unstable climates (Scheffers et al., 2017). Bellard et al. (2016) projected losses of land due to sea level rise in the East Australian Forest hotspot (H140), and González-Orozco et al. (2016) projected the contraction of eucalyptus species towards the coast of the Southwest Australia hotspot (H134), exposing them to sea level rise. In New Zealand forests (H139), native plants may be replaced by more fire-resistant introduced species following climate change-related fires (Perry et al., 2014). While forest growth is projected to potentially increase due to carbon dioxide fertilization, this may be compromised by drought (low confidence) (Ausseil et al., 2013). Seed production in native New Zealand beech forests is projected to increase due to climate warming, fuelling the abundance of invasive rats and stoats, which then predate native species and lead to loss of endemic fauna and flora (medium confidence) (Tompkins et al., 2013, Ch. 11).
About 80% of projections for assessed terrestrial species within insular biodiversity hotspots showed a negative impact of climate change, with ~50% at very high risk of extinction, including 100% of endemic species (medium confidence) (Figure CCP1.7; Manes et al., 2021). In addition to habitat loss and species range reductions, changes in precipitation are projected to be a major driver impacting tropical and subtropical island species (medium confidence) (Maharaj and New, 2013; Harter et al., 2015; Struebig et al., 2015; Vogiatzakis et al., 2016; Maharaj et al., 2018). Compared to continents, island species are projected to undergo greater impacts from changing climate, especially birds and amphibians (high confidence) (Fortini et al., 2015; Holmes et al., 2015; Manes et al., 2021, Box CCP1.1). Of all biodiversity hotspots, island species face the highest proportion of extirpation risk at high elevations due to decreasing habitat area (e.g., Brown et al., 2015) and at low elevations from sea level rise, habitat loss and introduced species (medium confidence) (Bellard et al., 2014a).
CCP1.2.3 Freshwater
The 53 hotspots in freshwater ecosystems assessed here cover about 32,830,000 km 2 (17% of global freshwater habitats and 22% of the global land area), with a 68% overlap with terrestrial ecosystems (Table CCP1.1; Figure CCP1.2). They include lakes, rivers and streams (Figure CCP1.1 2).

Figure CCP1.1 2 | Photographs of freshwater biodiversity hotspots. Photos by Will Darwall (b, c) , Pablo Tedesco (a, d) , and Mark Costello (e, f).
CCP1.2.3.1 Observed Impacts
An analysis of trends in 190 river basins in Australia found that stream-flows have been declining, including in the Central Australian (H194) and Kimberley (H191) hotspots, due to greater terrestrial plant uptake of water in response to climate-related increases in carbon dioxide (low confidence) (Ukkola et al., 2016). We did not find any other publications providing evidence of impacts of climate change on freshwater biodiversity within the hotspots. Whether this is because freshwater temperatures tend to be cooler due to inputs from groundwater and/or mountain streams (Knouft and Ficklin, 2017), resilience of freshwater species or lack of research is unclear.
CCP1.2.3.2 Projected Impacts
Cold-water species are projected to lose habitat in Canada and this may apply in the Alaskan river (H143) and Russian Far East Lake Inle (H181) hotspots (medium confidence) (Comte et al., 2013). Water abstraction is significant in the Colorado river hotspot (H145) and reduces its resilience to climate change effects on flow rates (Grafton et al., 2013).
In South America, in the Brazilian Amazon hotspot (H153, 154, 157), half the assessed fish species were considered sensitive to increased temperatures and reduced oxygen due to climate change (low confidence) (Frederico et al., 2016). The use of protected areas was recommended to reduce the impacts of deforestation and water pollution (Jézéquel et al., 2020). El Niño-related floods have led to declines in numbers of caiman, a top predator in the Brazilian Paraná river hotspot (H158), which indicates that increased floods due to climate change may reduce its population and alter food webs (Herrera et al., 2015).
In Europe, including the Mediterranean freshwater hotspots, climate change is projected to result in reduced river flow, low oxygen in summer, salinity incursions, further eutrophication and spread of invasive species, compromising the survival of native biodiversity (medium confidence) (Moss et al., 2009). The longer growth season in the boreal and Arctic latitudes is projected to aid the invasion of exotic species, and increase lake stratification resulting in lower oxygen below the hypolimnion (medium confidence). In addition, strict cold-water species are projected to lose suitable habitat (Moss et al., 2009). An analysis of 1648 species of freshwater fish, amphibians, turtles, plants, molluscs, crayfish and dragonflies, projected ~6% of common and ~77% of rare species to lose 90% of their geographic range (low confidence) (Markovic et al., 2014). Even if some species can spread to other areas and follow the climate, Markovic et al. (2014) projected a loss of species, especially molluscs, from the southeastern Mediterranean, including the Balkan biodiversity hotspot (H162) (medium confidence). Similarly, within Europe, Mediterranean fish (Jarić et al., 2019) and insects (Conti et al., 2014) are the most threatened by climate warming, droughts and floods. The fish species of the Danube river delta hotspot (H161) are less susceptible to climate change than in the Balkans (H162) and Anatolian (H163) hotspots. The rest of Europe, from the Iberian Peninsula to Scandinavia is not classified as a biodiversity hotspot. Thus, the areas where freshwater biodiversity is most threatened by climate change in Europe are in two of the three hotspots (high confidence).
The African Rift Valley Lakes (H171), including Lakes Tanganyika and Turkana, are suffering from climate change influenced drought, potentially impacting freshwater biodiversity (medium confidence) (Dudgeon et al., 2006). Africa and Madagascar (H172) are projected to see a climate-driven 10% reduction in freshwater flow that is projected to threaten the survival of ~9% of freshwater-dependent fish and birds (low confidence) (Thieme et al., 2010). Climate change is projected to increase the extinction vulnerability of most freshwater fish in the western South Africa Cape hotspot (H170) (low confidence) (Shelton et al., 2018).
In Asia, although climate change impacts on the Yangtze (H183) and Mekong river (H186) biodiversity hotspots have not been reported, they are subject to the range of human impacts of over-exploitation, pollution, water abstraction, altered flow regimes, habitat loss and spread of invasive species, which makes them more vulnerable to climate effects (medium confidence) (Dudgeon et al., 2006). The release of water from shrinking glaciers in Asia to some extent protects downstream freshwaters against drought, but half of these glaciers are projected to disappear by 2100 (medium confidence) (Pritchard, 2019).
In Australia, the Murray-Darling river basin occupies much of the Eastern Rivers hotspot (H195) and climate-related drought exacerbated by water abstraction is projected to drive declines in freshwater birds, fish and invertebrates (high confidence) (Grafton et al., 2013). However, a national scale analysis projected climate change to cause freshwater species range shifts, but no losses of species in this hotspot (low confidence) (James et al., 2017, WG2 Ch. 11).
CCP1.2.4 Marine
The 43 hotspots in marine ecosystems cover 46,600,000 km2, representing 9% of the ocean area (Table CCP1.1; Figure CCP1.2). They include coral reef ecosystems, kelp forests, seagrass meadows, polar and upwelling zones (Figures CCP1.1 3; CCP1.1 4).

Figure CCP1.1 4 | Species in island coral and rocky reef biodiversity hotspots. Photos by Galice Hoarau (top four Sulawesi), and Mark Costello (other nine).

Figure CCP1.1 3 | High-latitude marine biodiversity hotspots. Northeast Atlantic temperate seagrass beds, soft-corals, and kelp forests in Norway (photos by Galice Hoarau). South African fynbos and Agulhas current and Antarctic Peninsula and Weddell Sea (photos by Denis Costello). In the Americas, the Humboldt Current Chile and Chesapeake Bay (photos by Mark Costello).
CCP1.2.4.1 Observed Impacts
Observed impacts attributable to climate change are strongly biased geographically, with most data from the temperate Northern Hemisphere, followed by subtropical to temperate Australia and few long-term data in the tropics (Poloczanska et al., 2013; Poloczanska et al., 2016). Marine heatwaves have increased over the past century, causing mass mortalities in the hotspots of the Mediterranean (H216), Great Barrier Reef (H236), western and southern Australia (H227, 228), northwest Atlantic (H207) and northeast Pacific (H197) (high confidence) (Hobday et al., 2018; Oliver et al., 2018). The shift of thousands of species from equatorial latitudes since the 1950s has been attributed to climate warming (medium confidence) (Chaudhary et al., 2021).
Climate change-related hazards, particularly marine heat events, have caused widespread coral bleaching and mass mortalities as the time between consecutive bleaching events decreases (high confidence) (IPCC, 2018; Bindoff et al., 2019; IPCC, 2019b). Coral reefs in some Indian Ocean hotspots (H230, 234) already exhibit net loss of coral reefs (low confidence) (Perry et al., 2018). While coral bleaching is a visible symptom of heat stress, warming has also induced restructuring of associated fish and invertebrate communities in the Great Barrier Reef (H236) (medium confidence) (Stuart-Smith et al., 2018).
Although the number of coral species that are both exposed and vulnerable to climate hazards is greatest in the central Indo-Pacific, the proportion of corals at risk is greater in the lower diversity Caribbean hotspots (H209) (medium confidence) (Foden et al., 2013). Some reef corals are able to acclimate to heatwaves (low confidence) (DeCarlo et al., 2019), and some have expanded their latitudinal ranges polewards (high confidence), up to 14 km yr –1 in the northwest Pacific (Yamano et al., 2011). Although future latitudinal expansions may be limited by winter light availability (Muir et al., 2015), new coral reefs are already emerging in Japan (Kumagai et al., 2018).
The Mediterranean Sea hotspot (H216) is negatively affected by climate change (high confidence) (Cross-Chapter Paper 4). Species entering via the Suez Canal from the Red Sea (H220) are facilitated by warming and lead to profound community changes (high confidence) (Yeruham et al., 2015; Rilov, 2016; Vasilakopoulos et al., 2017; Givan et al., 2018; Bianchi et al., 2019). In contrast, the more open coastal seas of the Atlantic and Pacific coasts of North America have had increasing species richness since the 1970s (Batt et al., 2017).
Kelp forests are in decline in mid-latitudes due to warming and associated increased herbivory (medium confidence) (Section 3.4.2.3, Chapter 11). South and southeastern (H228), and southwestern (H227) Australia have experienced a climate-related decline of kelp forests (Wernberg et al., 2011; Vergés et al., 2016; Wernberg et al., 2016). West Australia (H227) has been affected by extreme climate events characterised by the replacement of kelp and sessile invertebrates by algal turfs and warm-water fish species (Wernberg et al., 2013; Wernberg et al., 2016). Australia’s Great Barrier Reef (H236), kelp forests, seagrass meadows and mangroves (due to drought), have suffered mortalities due to climate change (medium confidence) (Babcock et al., 2019). Climate warming driven changes in seaweed assemblages have been reported not only in Australia, but in the marine biodiversity hotspots of Atlantic Canada, Japan, Mediterranean, New Zealand (Laffoley and Baxter, 2016; Thomsen et al., 2019; Thomsen and South, 2019) and California (H207, 231, 216, 238, 199) (Arafeh-Dalmau et al., 2019; McPherson et al., 2021). However, while climate change is having measurable effects on kelp, the dominant effects on kelp projected to 2025 are fishing, through its effects on herbivores and predators (medium confidence) (Steneck et al., 2002). Although fishing affected Atlantic cod in the Barents Sea (H214) and Gulf of Maine (H207) biodiversity hotspots, it was also affected by climate change, but negatively and positively, respectively (Kjesbu et al., 2014; Pershing et al., 2015).
Range expansions out of the Nansei Shoto (H231) hotspot south of Japan has led to the replacement of temperate kelp forests by tropical coral and herbivorous fishes on Japanese coasts (Kumagai et al., 2018). The Yellow Sea (H230) is one of the most exploited marine hotspots, with decreasing ecosystem services compounded by climate change but there is low confidence for climate change contributing substantially to ecological degradation (Wang et al., 2016; Song and Duan, 2019).
Upwelling systems are best known for bringing nutrients to the surface. These stimulate phytoplankton blooms, which in turn support important fisheries (Section 3.4.2.1 1). However, this deep water also tends to be low in oxygen, which can be further depleted by respiration and surface warming. Prolonged marine heatwaves in the Californian Current hotspot (H197) drove major shifts in the geographic range of birds, mammals, fish, crustaceans, molluscs and other species, and toxic algal blooms (Sanford et al., 2019).
In both the Antarctic (H213) and Arctic (H196, 214), the loss of ice impacts on the behaviour and foraging ability of marine mammals and birds (Doney et al., 2012). The retreat of sea ice in the Bering Sea (H196) hotspot has been followed by a reorganisation of the seabed and fish communities, a northward shift in species, and greater species’ biomass and richness (Mueter and Litzow, 2008; Grebmeier et al., 2018). In the Eurasian Arctic (H214), species richness has similarly been increasing (Węsławski et al., 2011; Kortsch et al., 2012; Certain and Planque, 2015; Fossheim et al., 2015; Węsławski et al., 2018), as has phytoplankton productivity (Arrigo et al., 2008). The distribution of krill has already contracted with ocean warming in the Southern Ocean (medium confidence) (Cox et al., 2018; Atkinson et al., 2019).
CCP1.2.4.2 Projected Impacts
Tropical extirpations, already underway (Section 1.2.4.1), are projected to reduce hotspot diversity especially in the Coral Triangle (H226, 232, 234), Maldives (H224) and, to a lesser extent, in the Caribbean (H200, H210) (Jones and Cheung, 2015; García Molinos et al., 2016) and Persian Gulf (H219) (Wabnitz et al., 2018). Paleo evidence supports projections of tropical biodiversity loss under high global warming (high confidence) (Kiessling et al., 2012; Yasuhara et al., 2020).
Warm-water coral reefs are expected to decline with 1.5°C warming (very high confidence) (King et al., 2017; Bindoff et al., 2019) leading to systems with reduced biodiversity and structural complexity (high confidence) (Chapters 3; 11; Box 11.2). In the Coral Triangle, marine heatwaves are projected to have the same effect as an added mean annual 0.5°C sea surface temperature increase (McManus et al., 2020). While some corals are expected to survive in deep ‘mesophotic’ reefs (Laverick and Rogers, 2019), the shallow coral reefs of today will not last the century if climate warming continues without mitigation (high confidence) (Hughes et al., 2018a; Hughes et al., 2018b; IPCC, 2018; Bindoff et al., 2019; Hughes et al., 2019b).
In the Mediterranean, ocean acidification has been projected to lead to increases of fleshy algae at the expense of calcifying algae (Zunino et al., 2017). However, seagrass has been projected to decline (Chefaoui et al., 2018) and increase (Zunino et al., 2017) in the Mediterranean Sea hotspot (H216). Kelp forests are expected to decline in the northwest Atlantic (Grand Banks, H207), whereas gains and losses are projected to be approximately balanced in the Northeast Atlantic Shelf (H215) under Representative Concentration Pathway (RCP) 8.5 (Assis et al., 2018; Wilson et al., 2019), but may lead to impoverished benthic assemblages (Teagle and Smale, 2018).
Projected climate caused changes in biodiversity in coastal upwelling regions are uncertain. While productivity in the California Current (H197) system is projected to increase with future climate change, nonlinear plankton responses and uncertain interactions with food web dynamics hinder predictions of ecosystem responses (Xiu et al., 2018). In addition, this hotspot is projected to suffer from ocean acidification by 2050 (Gruber et al., 2012).
Around Antarctica (H213), almost half of all species are endemic (Costello et al., 2010), and warming during this century is projected to cause a reduction in suitable thermal environment for 79% of its species (RCP8.5) (low confidence) (Basher and Costello, 2016; Griffiths et al., 2017). The previously mentioned declines in Southern Ocean krill due to climate change contribute to projected declines in baleen whales there (Tulloch et al., 2019).
Species richness in the northern polar hotspots is expected to increase substantially (high confidence) (Cheung et al., 2015). However, population sizes of presently occurring native species are expected to decline, especially in the Barents Sea (H214) (Koenigstein et al., 2018). Ocean acidification is projected to continue globally, and while its impact is uncertain and projected to be less than the effect of warming, it may lead to changes in marine food webs due to varying effects on marine species (Terhaar et al., 2020). Hotspots in temperate latitudes are projected to have assemblages modified by immigration from the tropics and emigration to polar waters. Where land barriers and other geographical limits to range shifts occur, limited dispersal and habitat fragmentation may also limit the capacity of some species to track climate velocities, such as in the Baltic Sea (H215) (Jonsson et al., 2018), Mediterranean Sea (H216) (Burrows et al., 2014; Arafeh-Dalmau et al., 2021) and Antarctica (H213) (medium confidence) (Cristofari et al., 2018).
CCP1.3 Adaptation and Solutions
Terrestrial, freshwater and coastal marine ecosystems are impacted by the 3 billion people that currently live in in biodiversity hotspots (Gutiérrez et al., 2021). At the same time, biodiversity in hotspots supports the livelihoods of the local communities. The suite of adaptation options for biodiversity are as applicable inside as outside hotspots (Table CCP1.2). Many of these hotspots are now faced with widespread fragmentation and habitat degradation (high confidence) (Table SMCCP1.1).
Because projected changes in biodiversity increase disproportionately with warming, climate change mitigation is the primary action to conserve biodiversity within hotspots. If global warming is kept within the 1.5°C limit of the Paris Agreement, just ~4% of endemic species in biodiversity hotspots would be threatened with extinction from climate change. However, at the current commitments there is projected to be ~3°C warming by 2100 and ~20% and ~32% for terrestrial and marine species, respectively, fall into the category of very high extinction risk (Figure CCP1.6; Manes et al., 2021).
Although mitigation can sharply reduce extinction risk associated with climate change (high confidence), it cannot reduce all of the risk, nor the risk associated with other drivers that can have a compound effect with climate change. Thus, in addition to mitigation, the literature consistently calls for reducing current non-climate impacts (e.g., habitat conversion, over-exploitation, hunting, fishing, wildfire, pollution, human-introduced invasive species) in order to increase biodiversity resilience to climate change (very high confidence) (Table CCP1.2; e.g., Mantyka-Pringle et al., 2015; Warren et al., 2018a; Costello, 2021). The main strategies to increase resilience rely on the combination of well-planned protected areas, restoration of degraded areas and the sustainable use of biodiversity (high confidence) (IPCC, 2019a; Pörtner et al., 2021) . On land, creating corridors for species is key for facilitating species movements (high confidence) (McGuire et al., 2016; Heikkinen et al., 2020; Pörtner et al., 2021). Habitat protection has numerous co-benefits, including potential climate mitigation through carbon storage and sequestration, in addition to climatic regulation (Alkama and Cescatti, 2016; Mackey et al., 2020) and pandemic prevention (Allen et al., 2017; Dobson et al., 2020, Cross-Chapter Box COVID-19 in Chapter 7).
Active relocation of endangered species to areas where they may be safer from predation and human impacts, as already practised for a few charismatic fauna, is expensive and fraught with complex regulations and concerns over impacts on native species (Brodie et al., 2021). Therefore, managed relocation of species threatened by climate change is questionable for most species.
Healthier marine ecosystems are more resilient to additional stressors, such as storms and climate change (high confidence) (Isbell et al., 2015; Duffy et al., 2016; Roberts et al., 2017; Bates et al., 2019; Mariani et al., 2020; Costello, 2021; Donovan et al., 2021). Extinction risk is lower when populations are larger and more genetically diverse, individuals are larger and older, and seabed habitats (e.g., coral, kelp, seagrass) are flourishing, as occurs in marine reserves (high confidence) (Costello, 2014; Roberts et al., 2017; Bates et al., 2019; Costello, 2021). Similarly, global fish biomass may be less affected by climate change if biodiversity is greater (Duffy et al., 2016). Thus, a network of reserves representative of global biodiversity, helps attenuate the effects of climate change (medium confidence), for example, by having more abundant fish and top predator populations (Roberts et al., 2017; Beyer et al., 2018; Carter et al., 2020; Sala et al., 2021). However, the impacts of marine heatwaves on corals across marine reserves illustrates that enhanced resilience is not enough to protect against extreme and future climate change conditions (high confidence) (Bruno et al., 2018; Hughes et al., 2018a; Kleypas et al., 2021).
Mangroves occupy the interface of terrestrial, freshwater and marine environments, dominate in eight hotspots (Table CCP1.1) and are connected to or integral habitats within one-third of all terrestrial and freshwater, and two-thirds of marine, hotspots (Figures CCP1.1; CCP1.2). A global analysis of sediment cores from mangroves indicated that mangroves can accrete sediment at levels of sea level rise projected under low emission scenarios, but may decline at their seaward edge under high emission scenarios (Saintilan et al., 2020, Chapter 3.4.2, Cross-Chapter Box Sea-level rise). However, even if this seaward erosion occurs, the expansion of mangroves inland due to sea level rise will increase carbon sequestration, because they capture carbon from seawater and freshwater runoff, in addition to photosynthesis, into their underlying sediments. If coastal management permits the expansion of mangroves inland with rising sea level, this will increase carbon sequestration because mangroves capture and preserve more carbon in their sediments than other terrestrial and marine forests and biomes (high confidence) (Table CCP1.2; Alongi, 2020; Goldstein et al., 2020; Lovelock and Reef, 2020; Saintilan et al., 2020).
On land, fragmentation and habitat degradation are particularly pervasive, imposing hard limits to adaptation of terrestrial and freshwater ecosystems (Ibisch et al., 2016; Lenoir et al., 2020; Mechler et al., 2020). Thus, the protection of existing natural habitats coupled with the restoration of the surrounding non-protected habitat can increase the effectiveness of adaptation strategies in terrestrial and freshwater hotspots (very high confidence) (Table CCP1.2; IPCC, 2019a; Jung et al., 2021). Additionally, strategic allocation of new protected areas within gaps across elevational and climatic gradients could enhance biodiversity conservation across hotspots. This would align with Target 3 of the Convention on Biological Diversity’s post-2020 draft Global Biodiversity Framework, and could include underrepresented climate and elevation spaces as well as potential climate refugia currently not under protection (Pörtner et al., 2021). In terrestrial ecosystems, restoration initiatives can help sustain biodiversity, improve resilience in a changing climate, and avoid maladaptation by selecting appropriate native species to be planted (Cross-Chapter Box Bioeconomy in Chapter 5; (Gann et al., 2019). In freshwater ecosystems, conservation needs catchment level management of human activities (Saunders et al., 2002; Dudgeon et al., 2006), especially as 37% of the terrestrial biodiversity hotspots overlap with freshwater (Figure CCP1.2) and 23% border marine hotspots (Olson and Dinerstein, 2002).
Protecting biodiversity hotspots is a pragmatic way to conserve biodiversity that is representative of a substantive fraction of genetic and species diversity on Earth (Mittermeier et al., 2011) while achieving co-benefits (Bonan, 2016; Sala et al., 2021). Protecting hotspots also helps protect important ecosystem services. In a global ranking of areas that combine biodiversity conservation while maximising carbon retention and water quality regulation, for example, the terrestrial and freshwater hotspots assessed here ranked high (41st and 34th on average, respectively, on a scale of 100) (Jung et al., 2021). The solutions needed to reverse biodiversity decline are well known and articulated in numerous international agreements and goals, such as the Convention of Biological Diversity the United Nations’ Sustainable Development Goals, the Nationally Determined Contributions under the Paris Agreement, the International Union for Nature Conservation’s Bonn Restoration Challenge and the Ramsar Convention on Wetland Conservation. Thus, expanding and enhancing protection of a worldwide network of fully protected areas and protection and restoration of non-protected areas representative of the biodiversity hotspots, including marine, freshwater and terrestrial environments, is a highly recommended adaptation strategy to increase resilience of biodiversity to climate change (Brito-Morales et al., 2018). However, adaptation strategies alone cannot protect biodiversity from climate impacts without complementary and concomitant reduction of greenhouse gas emissions.
Table CCP1.2 | Examples of adaptation actions that benefit the conservation of biodiversity and climate change mitigation.
Actions | Terrestrial | Freshwater | Marine |
Protect biodiversity hotspots | Protect native forests, bush and grasslands | Stop pollution and sedimentation into streams, rivers, ponds and lakes | Ban seabed trawling and dredging |
Control introduction and spread of invasive species and pests | |||
Increase connectivity | Use riverbank and hedgerow corridors to connect protected native habitats | Already connected | |
Reduce habitat and species loss outside protected areas to add species dispersal (corridors) | |||
Outside biodiversity hotspots | Environmentally sustainable agriculture, tourism and other land and freshwater uses | Environmentally sustainable aquaculture, fisheries and tourism | |
Restoration and recovery | Actively rehabilitate old mines, quarries and industrial lands | Stabilise riverbanks Remove weirs and artificial barriers to fish migration | Ban removal of marine life and habitat and fishing in selected areas to allow passive recovery of habitats, natural population structure, and food webs |
Reintroduce extirpated native species | |||
Reduce erosion, soil loss and flooding | Preserve, reduce degradation and restore habitats to enable uplands to absorb rainfall and reduce flash floods Protect sand-dune systems from erosion due to human and farm animal trampling Set aside land for salt marshes and mangroves to buffer against river and seawater flooding Link estuarine and upriver protected areas to provide more wildlife habitat and absorb storm surges and floods | ||
Urban development | Concentrate development to more cost efficiently manage transport and waste management infrastructure | Limit upland development where it may affect freshwater quality | Avoid construction in areas at risk of sea level rise and associated storm surges |
Greenhouse gas mitigation | Prevent deforestation Reforestation (especially mangroves) Revegetation Fewer farm mammals Minimise release of greenhouse gases from soils | Expand wetlands to capture and deposit carbon in soils | Limit seabed disturbance by trawling and dredging that releases CO2 and CH4 Eliminate fishery subsidies and remove tax breaks on fuel for fishing boats |
Carbon sequestration and preservation | Allow plants and other organisms to flourish and capture CO2 from the air and water, and sequester it in biomass, soils and sediments | ||
Manage forestry to maximise in situ food web biomass | Manage fisheries to maximise in situ food web biomass | ||
Social | Communicate information on the benefits of adaptation measures to the public | ||
Political and economic | Provide leadership and governance of mitigation and adaptation measures, including through regulations and economic incentives that guide the transition to a low carbon emissions economy | ||
Scientific | Address data gaps and make monitoring data and its meaning rapidly available to society so that the public and policy makers are informed of trends in biodiversity and related factors, including climate variables, extreme weather related events, threatened and invasive species, natural habitats, and their relationships | ||
Conduct research to improve understanding of cause-effect relationships regarding environmental factors and biodiversity trends, including in nature conservation, forestry, agriculture, fisheries and food production sectors, and improve projections of consequences of management action and inaction | |||
Box CCP1.1 | Climate change and terrestrial biodiversity hotspots on small islands
Despite covering approximately 2% of the Earth’s land area, islands harbour more than 20% of extant terrestrial species (Wetzel et al., 2013). Islands have disproportionately higher rates of endemism and threat when compared to continents, with 80% of historical extinctions (since 1500 CE) having occurred on islands (high confidence) (Taylor and Kumar, 2016; Spatz et al., 2017; Dueñas et al., 2021). Current climate change projections suggest that insular species are particularly sensitive and, even at mild warming levels, substantial losses are expected (high confidence) (Pouteau and Birnbaum, 2016; Taylor and Kumar, 2016; Dawson et al., 2017; Manes et al., 2021). Given islands’ characteristic high endemicity, current high threat levels and the fact that islands host almost half of all species currently considered to be at risk of extinction, especially at higher warming levels (high confidence) (Taylor and Kumar, 2016; Spatz et al., 2017), further losses could contribute disproportionately to global biodiversity decline (medium evidence, high agreement ) (Harter et al., 2015; Pouteau and Birnbaum, 2016; Manes et al., 2021).
The high vulnerability of terrestrial biodiversity on islands to global change can be explained by a number of limitations, characteristic of both islands and insular species. Older, isolated islands tend to have fewer species and lower functional redundancy but a higher proportion of endemism (Pouteau and Birnbaum, 2016; Médail, 2017). Many of these islands contain species with inherently high sensitivity to environmental change (narrow habitat ranges, small population sizes, low genetic diversity and poor adaptive, dispersal and defensive capabilities) (Harter et al., 2015). Unlike continental environments, insular species often have limited opportunities for autonomous adaptation from not having enough geographic space to shift their ranges to track suitable climatic conditions (high confidence) (Fortini et al., 2015; Manes et al., 2021). Local extinction risks are amplified by even small losses of habitat due to global change including human-induced disturbances, extreme events, sea level rise (Chapter 15; Cross-Chapter Box SLR in Chapter 3) and invasive species.
However, some insular species have shown resilience to climate change. Intact island forests, for example, have shown rapid recovery rates after tropical cyclones, despite high levels of initial damage, especially in the Caribbean (medium confidence) (Luke et al., 2016; Richardson et al., 2018). Additionally, many Mediterranean islands are ‘disturbance adapted’, with continued persistence of some single-island endemic plants, despite exposure to multiple threats (Vogiatzakis et al., 2016). This continued persistence has been attributed, at least partially, to climate refugia, oceanic buffering and high habitat heterogeneity within topographically complex mountainous regions (Pouteau and Birnbaum, 2016; Médail, 2017, Chapter 15, Table 15.1). However, this climate resilience will not be sustained under climate change, especially when coupled with habitat degradation (high confidence) (Wiens, 2016).
Adaptation strategies depend on the ability to project future impacts from climate change, but this is hampered by lack of fine-scale climate data, especially for developing small island nations. There is a paucity of robust impacts-based modelling output for terrestrial biodiversity from these islands due to the wide, chronic unavailability of Regional Climate Model (RCM) data premised on the most recent suite of scenarios (RCPs and especially SSPs) (medium evidence, high agreement ) (Gutiérrez et al., 2021, Ch.15.8; Pörtner et al., 2021; WMO, 2021). Additionally, realistic assessments of changing climate on such small ecosystems require further RCM downscaling and verification to sub-island resolutions of <5 km. Furthermore, widely used statistically (bias-corrected) downscaled data at sub-5 km resolutions, such as WorldClim are often unsuitable due to limited spatial and temporal resolutions of observation station data from small islands (Maharaj and New, 2013; Gutiérrez et al., 2021) and higher errors associated with statistical downscaling and locations with complex topography and coastlines (Fick and Hijmans, 2017; Lanzante et al., 2018). Widespread unavailability of such data constrains accurate simulations of climatic variation within the small-scale mountainous and coastal regions of islands, associated with climate refugia and high habitat heterogeneity (high confidence) (Balzan et al., 2018). This is a key element contributing to the continued delay in development of robust adaptation strategies towards not only biodiversity conservation but other important cross-sectoral issues (medium confidence) (Robinson, 2020b).
Due to islands’ limited size and isolation, conventional conservation measures focused on expanding protected areas, dispersal corridors and buffer zones are of limited effectiveness on islands (high confidence) (Vogiatzakis et al., 2016). Instead, multifaceted, locally driven holistic climate-smart strategies across mosaics of human-impacted, often heavily degraded and fragmented, landscapes are required. These should ideally be long-term, flexible and sustainable solutions that incorporate social and biocultural knowledge as well as economic co-benefits to island communities in order to ‘buy time’ (Betzold, 2015; Robinson, 2020a). Examples include ecosystem-based approaches such as ridge-to-reef management (Struebig et al., 2015; Ferreira et al., 2019, Figure CCP1.1 5.4), which incorporates conservation partnerships among lands inside and outside protected areas to increase connectivity and reduce land use impacts, while building on the interconnections among terrestrial, freshwater, coastal and marine ecosystems. Such strategies require raising awareness of biodiversity values among local communities, and cross-sectoral planning and policy at both island, regional and trans-boundary scales. These lend to private–public partnerships, increasing the potential of solutions reaching beyond protected areas boundaries and affecting socio-political change (high confidence) (Scobie, 2016).
Box CCP1.1
Limited terrain, natural, economic and data resources across small developing nation islands mean that unconstrained habitat destruction and degradation cannot be sustained, as this harms both people and the biodiversity upon which they depend. This limitation of resources compromises climate adaptation, which is often further complicated by varying governance and states of economic development (Petzold and Magnan, 2019). With changing climate conditions, there is an increased urgency to re-think how progress can be measured, and to create opportunities building on synergies between disaster risk reduction, food security and social justice, so that islands can most benefit from their natural resources and biodiversity in a sustained manner (Box 15.2; Section 15.3.4.4 ).
Frequently Asked Questions
FAQ CCP1.1 | Why are biodiversity hotspots important?
Biodiversity hotspots are regions that are exceptionally rich in species, ecologically unique and which may contain geographically restricted species. They are thus priority targets for nature conservation.
Recognising that the Convention on Biological Diversity definition of biodiversity includes the variation within and between species and of ecosystems, different schemes have been applied to define hotspots, leading to hundreds of different areas being proposed as hotspots. However, all identify a set of priority areas that cover a small portion of the Earth, but house an exceptionally high proportion of its biodiversity. Because biodiversity underpins all life on Earth, these hotspots have significant global value as they contain species and habitats that are found nowhere else. Their loss would mean loss of species and habitats that provide wild and farmed food, medicine and other materials, and services such as climate regulation, pollination and water purification, all of which maintain the health of the ecosystems we depend upon.
Healthy ecosystems, with flourishing biodiversity in natural conditions, are more resilient to disturbances, whether natural or human in origin. Environmentally sustainable development inside and outside hotspots could help reverse human impacts on biodiversity. The hotspots also capture and store carbon, thereby helping to mitigate climate change. Prioritisation of protecting biodiversity in hotspots thus benefits nature conservation and helps mitigate climate change. A global network of protected areas and restoration initiatives inside biodiversity hotspots can also help increase resilience to the effects of climate change on biodiversity.
FAQ CCP1.2 | How can society ensure conservation of biodiversity in climate policies?
To reduce the effects of climate change on biodiversity, it is first essential to address direct human impacts that are already leading to a loss of biodiversity. This can be achieved by protecting biodiversity in conservation areas, restoring biodiversity everywhere possible and promoting sustainable development. Climate policies should thus integrate with policies to protect and restore nature.
Avoiding further loss of biodiversity is implicit in sustainable development. This needs to happen on land, rivers, lakes and in the oceans. It is especially important in ‘biodiversity hotspots’ (FAQ 1.1) and protected areas to minimise species losses. Hence calls by the International Union for the Conservation of Nature, Convention on Biological Diversity, United Nations Sustainable Development Goals (SDGs) to increase the size and connectivity of fully protected areas (which aim to have biodiversity in a near natural condition) and include in them the biodiversity hotspots, need to be immediately implemented.
Five of the SDGs are life on land, life below water, good health and well-being, food security and climate action. They underpin and interact with many other SDGs. Healthy ecosystems play a role in mitigating greenhouse gas emissions, not only protecting areas to prevent the release of carbon through land conversion activities but also restoring otherwise degraded land. The United Nations has declared 2021–2030 as the Decade on Ecosystem Restoration and the Decade of Ocean Science for Sustainable Development. Restoration means actively or passively allowing habitat to return to its natural state (e.g., grassland, forest, peatland, oyster beds), including replanting native vegetation. This can benefit the recovery of biodiversity, help remove carbon dioxide from the atmosphere and improve the delivery of nature’s contributions to people, such as climate regulation, water purification, pollination, and pest and disease control. Thus, protecting biodiversity helps to meet two SDGs directly, and three indirectly.
On land, the loss of natural forests and grasslands not only means a loss of carbon and many of their associated species, but exposes soils to erosion, affecting food production, and can affect the climate by altering the water cycle. Sustainable development, even within hotspots, involves active restoration of natural biodiversity, reducing poaching and trafficking of wildlife (UN SDG 15), and needs to include agriculture. This includes working to ensure biodiverse soils and supporting healthy pollinator populations. Biodiversity includes not only wild species but also genetic diversity, including crops and wild crop relatives. These wild relatives may contain important genes that could help farmed crops survive better in a changed climate. At least some of these wild relatives come from areas designated as hotspots. In the ocean, sustainable development means reducing pollution, carefully managed aquaculture development, increased protected areas (from the present 2.5% of the ocean area), enforcement of fisheries regulations, and removal of fishery subsidies that perpetuate overfishing within Exclusive Economic Zones and on the High Seas (UN SDG 14). Generally, the use of freshwaters, rivers, lakes and groundwaters, has not been sustainable and there is a need to restore biodiversity and water quality by eliminating pollution and to better manage abstraction, river flows, fishing and invasive species. Thus, as is the case with land and oceans, climate policies must prioritise the restoration of freshwater biodiversity, and reduction of the current negative impacts of human activities.
References
Abolafya, M., O. Onmuş, Ç. H. Şekercioğlu and R. Bilgin, 2013: Using Citizen Science Data to Model the Distributions of Common Songbirds of Turkey Under Different Global Climatic Change Scenarios. PLOS ONE, 8 (7), e68037, doi:10.1371/journal.pone.0068037.
Ahmadi, M. et al., 2019: Extinction risks of a Mediterranean neo-endemism complex of mountain vipers triggered by climate change. Scientific Reports, 9 (1), 6332, doi:10.1038/s41598-019-42792-9.
Ali, K. and H. A. Begum, 2015: A comparative assessment of climate change effect on some of the important tree species of Hindu-Kush Himalayas, using predictive modelling techniques. International Journal of Advanced Research, 3 (5), 1230–1240, doi:10.15242/IICBE.C0415015.
Alkama, R. and A. Cescatti, 2016: Biophysical climate impacts of recent changes in global forest cover. Science, 351 (6273), 600–604, doi:10.1126/science.aac8083.
Allen, T. et al., 2017: Global hotspots and correlates of emerging zoonotic diseases. Nature Communications, 8 (1), 1124, doi:10.1038/s41467-017-00923-8.
Alongi, D. M., 2020: Global Significance of Mangrove Blue Carbon in Climate Change Mitigation. Sci, 2 (3), 67, doi:10.3390/sci2030067.
Arafeh-Dalmau, N. et al., 2021: Incorporating climate velocity into the design of climate-smart networks of marine protected areas. Methods in Ecology and Evolution, in press, doi:doi.org/10.1111/2041-210X.13675.
Arafeh-Dalmau, N. et al., 2019: Extreme marine heatwaves alter kelp forest community near its equatorward distribution limit. Frontiers in Marine Science, 6 (499), doi:10.3389/fmars.2019.00499.
Arrigo, K. R., G. van Dijken and S. Pabi, 2008: Impact of a shrinking Arctic ice cover on marine primary production. Geophysical Research Letters, 35 (19), doi:10.1029/2008gl035028.
Aryal, A. et al., 2016: Predicting the distributions of predator (snow leopard) and prey (blue sheep) under climate change in the Himalaya. Ecology and Evolution, 6 (12), 4065–4075, doi:10.1002/ece3.2196.
Asaad, I., C. J. Lundquist, M. V. Erdmann and M. J. Costello, 2017: Ecological criteria to identify areas for biodiversity conservation. Biological Conservation, 213, 309–316, doi:10.1016/j.biocon.2016.10.007.
Assis, J., M. B. Araújo and E. A. Serrão, 2018: Projected climate changes threaten ancient refugia of kelp forests in the North Atlantic. Global Change Biology, 24 (1), e55-e66, doi:10.1111/gcb.13818.
Atkinson, A. et al., 2019: Krill (Euphausia superba) distribution contracts southward during rapid regional warming. Nature Climate Change, 9 (2), 142–147, doi:10.1038/s41558-018-0370-z.
Ausseil, A.-G. E. et al., 2013: Climate regulation in New Zealand: contribution of natural and managed ecosystems. In: Ecosystem services in New Zealand–conditions and trends[Dymond, J. R. (ed.)]. Manaaki Whenua Press, Lincoln, pp. 386–399.
Babcock, R. C. et al., 2019: Severe continental-scale impacts of climate change are happening now: Extreme climate events impact marine habitat forming communities along 45% of Australia’s coast. Frontiers in Marine Science, 6 (411), doi:10.3389/fmars.2019.00411.
Baker, D. J. et al., 2015: Assessing climate change impacts for vertebrate fauna across the West African protected area network using regionally appropriate climate projections. Diversity and Distributions, 21 (9), 991–1003, doi:10.1111/ddi.12337.
Balzan, M. V., M. Potschin-Young and R. Haines-Young, 2018: Island ecosystem services: insights from a literature review on case-study island ecosystem services and future prospects. International Journal of Biodiversity Science, Ecosystem Services & Management , 14 (1), 71–90, doi:10.1080/21513732.2018.1439103.
Banag, C. et al., 2015: Bioclimatic niches of selected endemic Ixora species on the Philippines: predicting habitat suitability due to climate change. Plant Ecology, 216 (9), 1325–1340, doi:10.1007/s11258-015-0512-6.
Barbero, R. et al., 2020: Attributing Increases in Fire Weather to Anthropogenic Climate Change Over France. Frontiers in Earth Science, 8 (104), doi:10.3389/feart.2020.00104.
Basher, Z. and M. J. Costello, 2016: The past, present and future distribution of a deep-sea shrimp in the Southern Ocean. PeerJ, 4, e1713, doi:10.7717/peerj.1713.
Bates, A. E. et al., 2019: Climate resilience in marine protected areas and the ‘Protection Paradox’. Biological Conservation, 236, 305–314, doi:10.1016/j.biocon.2019.05.005.
Batt, R. D. et al., 2017: Gradual changes in range size accompany long-term trends in species richness. Ecology Letters, 20 (9), 1148–1157, doi:10.1111/ele.12812.
Bellard, C., C. Leclerc and F. Courchamp, 2014a: Impact of sea level rise on the 10 insular biodiversity hotspots. Global Ecology and Biogeography, 23 (2), 203–212, doi:10.1111/geb.12093.
Bellard, C., C. Leclerc, B. D. Hoffmann and F. Courchamp, 2016: Vulnerability to climate change and sea-level rise of the 35th biodiversity hotspot, the Forests of East Australia. Environmental Conservation, 43 (1), 79–89, doi:10.1017/S037689291500020X.
Bellard, C. et al., 2014b: Vulnerability of biodiversity hotspots to global change. Global Ecology and Biogeography, 23 (12), 1376–1386, doi:10.1111/geb.12228.
Beltrán, B. J. et al., 2014: Effects of climate change and urban development on the distribution and conservation of vegetation in a Mediterranean type ecosystem. International Journal of Geographical Information Science, 28 (8), 1561–1589, doi:10.1080/13658816.2013.846472.
Betzold, C., 2015: Adapting to climate change in small island developing states. Climatic Change, 133 (3), 481–489, doi:10.1007/s10584-015-1408-0.
Beyer, H. L. et al., 2018: Risk-sensitive planning for conserving coral reefs under rapid climate change. Conservation Letters, 11 (6), e12587, doi:10.1111/conl.12587.
Bianchi, C. N. et al., 2019: Abrupt change in a subtidal rocky reef community coincided with a rapid acceleration of sea water warming. Diversity, 11 (11), 215, doi:10.3390/d11110215.
Bindoff, N. L., W. L. Cheung and J. G. Kairo, 2019: Changing ocean, marine ecosystems, and dependent communities. In: IPCC Special Report on the Ocean and Cryosphere in a Changing Climate[Pörtner, H.-O., D. C. Roberts, V. Masson-Delmotte, P. Zhai, M. Tignor, E. S. Poloczanska, K. Mintenbeck, M. Nicolai, A. Okem, J. Petzold, B. Rama and N. Weyer (eds.)], pp. 65–72. ISBN 0906-7590.
Blowes, S. A. et al., 2019: The geography of biodiversity change in marine and terrestrial assemblages. Science, 366 (6463), 339–345, doi:10.1126/science.aaw1620.
Bonan, G. B., 2016: Forests, Climate, and Public Policy: A 500-Year Interdisciplinary Odyssey. Annual Review of Ecology, Evolution, and Systematics, 47 (1), 97–121, doi:10.1146/annurev-ecolsys-121415-032359.
Bowler, D. E. et al., 2020: Mapping human pressures on biodiversity across the planet uncovers anthropogenic threat complexes. People and Nature, 2 (2), 380–394, doi:10.1002/pan3.10071.
Braby, M. F., C. Bertelsmeier, C. Sanderson and B. M. Thistleton, 2014: Spatial distribution and range expansion of the Tawny Coster butterfly, Acraea terpsicore (Linnaeus, 1758) (Lepidoptera: Nymphalidae), in South-East Asia and Australia. Insect Conservation and Diversity, 7 (2), 132–143, doi:10.1111/icad.12038.
Brander, K. M., 2007: Global fish production and climate change. Proceedings of the National Academy of Sciences of the United States of America, 104 (50), 19709–19714, doi:10.1073/pnas.0702059104.
Brito-Morales, I. et al., 2018: Climate velocity can inform conservation in a warming world. Trends Ecol. Evol. , 33 (6), 441–457, doi:10.1016/j.tree.2018.03.009.
Brito-Morales, I. et al., 2020: Climate velocity reveals increasing exposure of deep-ocean biodiversity to future warming. Nature Climate Change, 10 (6), 576–581, doi:10.1038/s41558-020-0773-5.
Brodie, J. F. et al., 2021: Global policy for assisted colonization of species. Science, 372 (6541), 456–458.
Brown, K. A. et al., 2015: Predicting plant diversity patterns in Madagascar: Understanding the effects of climate and land cover change in a biodiversity hotspot. PLOS ONE, 10 (4), e0122721, doi:10.1371/journal.pone.0122721.
Brown, S. C. et al., 2020: Persistent Quaternary climate refugia are hospices for biodiversity in the Anthropocene. Nature Climate Change, 10 (3), 244–248, doi:10.1038/s41558-019-0682-7.
Bruno, J. F. et al., 2018: Climate change threatens the world’s marine protected areas. Nature Climate Change, 8, 499–503.
Burrows, M. T. et al., 2019: Ocean community warming responses explained by thermal affinities and temperature gradients. Nature Climate Change, 9 (12), 959–963, doi:10.1038/s41558-019-0631-5.
Burrows, M. T. et al., 2011: The pace of shifting climate in marine and terrestrial ecosystems. Science, 334 (6056), 652–655, doi:10.1126/science.1210288.
Burrows, M. T. et al., 2014: Geographical limits to species-range shifts are suggested by climate velocity. Nature, 507 (7493), 492-+, doi:10.1038/nature12976.
Cahill, A. E. et al., 2013: How does climate change cause extinction?Proceedings of the Royal Society B: Biological Sciences, 280 (1750), doi:10.1098/rspb.2012.1890.
Carter, A. L. et al., 2020: Assessing opportunities to support coral reef climate change refugia in MPAs: A case study at the Revillagigedo Archipelago. Marine Policy, 112, 103769, doi:10.1016/j.marpol.2019.103769.
Casazza, G. et al., 2014: Climate change hastens the urgency of conservation for range-restricted plant species in the central-northern Mediterranean region. Biological Conservation, 179, 129–138, doi:10.1016/j.biocon.2014.09.015.
Certain, G. and B. Planque, 2015: Biodiversity baseline for large marine ecosystems: an example from the Barents Sea. ICES Journal of Marine Science, 72 (6), 1756–1768, doi:10.1093/icesjms/fsv040.
Chaudhary, C., A. J. Richardson, D. S. Schoeman and M. J. Costello, 2021: Global warming is causing a more pronounced dip in marine species richness around the equator. Proceedings of the National Academy of Sciences, 118 (15), e2015094118, doi:10.1073/pnas.2015094118.
Chefaoui, R. M., C. M. Duarte and E. A. Serrão, 2018: Dramatic loss of seagrass habitat under projected climate change in the Mediterranean Sea. Global Change Biology, 24 (10), 4919–4928, doi:10.1111/gcb.14401.
Cheung, W. W. L., R. D. Brodeur, T. A. Okey and D. Pauly, 2015: Projecting future changes in distributions of pelagic fish species of Northeast Pacific shelf seas. Progress in Oceanography, 130, 19–31, doi:10.1016/j.pocean.2014.09.003.
Cheung, W. W. L., M. C. Jones, G. Reygondeau and T. L. Frölicher, 2018: Opportunities for climate-risk reduction through effective fisheries management. Global Change Biology, 24 (11), 5149–5163, doi:10.1111/gcb.14390.
Cohen, M. C. L. et al., 2018: Decadal-scale dynamics of an Amazonian mangrove caused by climate and sea level changes: Inferences from spatial–temporal analysis and digital elevation models. Earth Surf. Process. Landforms, 43 (14), 2876–2888, doi:10.1002/esp.4440.
Collen, B. et al., 2014: Global patterns of freshwater species diversity, threat and endemism. Glob Ecol Biogeogr, 23 (1), 40–51, doi:10.1111/geb.12096.
Comte, l., L. Buisson, M. Daufresne and G. Grenouillet, 2013: Climate-induced changes in the distribution of freshwater fish: observed and predicted trends. Freshwater Biology, 58 (4), 625–639, doi:10.1111/fwb.12081.
Conti, L., A. Schmidt-Kloiber, G. Grenouillet and W. Graf, 2014: A trait-based approach to assess the vulnerability of European aquatic insects to climate change. Hydrobiologia, 721 (1), 297–315, doi:10.1007/s10750-013-1690-7.
Corlett, R. T., 2011: Impacts of warming on tropical lowland rainforests. Trends Ecol. Evol. , 26 (11), 606–613, doi:10.1016/j.tree.2011.06.015.
Costello, M. J., 2014: Long live Marine Reserves: A review of experiences and benefits. Biological Conservation, 176, 289–296, doi:10.1016/j.biocon.2014.04.023.
Costello, M. J., 2015: Biodiversity: the known, unknown, and rates of extinction. Current biology : CB, 25 (9), R368–371, doi:10.1016/j.cub.2015.03.051.
Costello, M. J., 2019: Unhelpful inflation of threatened species. Science, 365 (6451), 332–333, doi:10.1126/science.aay3467.
Costello, M. J., 2021: Biodiversity conservation through protected areas supports healthy ecosystems and resilience to climate change and other disturbances. In: Imperiled: The Encyclopedia of Conservation. Reference Module in Earth Systems and Environmental Sciences[Goldstein, M. I. and D. A. DellaSala (eds.)]. Elsevier, Amsterdam. ISBN 9780124095489.
Costello, M. J. et al., 2010: A census of marine biodiversity knowledge, resources, and future challenges. PLOS ONE, 5 (8), e12110, doi:10.1371/journal.pone.0012110.
Costello, M. J. et al., 2017: Marine biogeographic realms and species endemicity. Nature Communications, 8 (1), 1057, doi:10.1038/s41467-017-01121-2.
Cox, M. J. et al., 2018: No evidence for a decline in the density of Antarctic krill Euphausia superba Dana, 1850, in the Southwest Atlantic sector between 1976 and 2016. Journal of Crustacean Biology, 38 (6), 656–661, doi:10.1093/jcbiol/ruy072.
Cristofari, R. et al., 2018: Climate-driven range shifts of the king penguin in a fragmented ecosystem. Nature Climate Change, 8 (3), 245–251, doi:10.1038/s41558-018-0084-2.
Darwall, W. et al., 2018: The Alliance for Freshwater Life: A global call to unite efforts for freshwater biodiversity science and conservation. Aquatic Conservation: Marine and Freshwater Ecosystems, 28 (4), 1015–1022, doi:10.1002/aqc.2958.
DasGupta, R. and R. Shaw, 2013: Cumulative impacts of human interventions and climate change on mangrove ecosystems of south and southeast asia: An overview. Journal of Ecosystems, 2013, 15, doi:10.1155/2013/379429.
Davidson, S. C. et al., 2020: Ecological insights from three decades of animal movement tracking across a changing Arctic. Science, 370 (6517), 712–715, doi:10.1126/science.abb7080.
Dawson, W. et al., 2017: Global hotspots and correlates of alien species richness across taxonomic groups. Nature Ecology & Evolution, 1 (7), 0186, doi:10.1038/s41559-017-0186.
de Faria, A., M. Marabesi, M. Gaspar and M. França, 2018: The increase of current atmospheric CO2 and temperature can benefit leaf gas exchanges, carbohydrate content and growth in C4 grass invaders of the Cerrado biome. Plant Physiology and Biochemistry, 127, 608–616, doi:10.1016/j.plaphy.2018.04.042.
de Oliveira, G. et al., 2015: Conservation biogeography of the Cerrado’s wild edible plants under climate change: Linking biotic stability with agricultural expansion. American journal of botany, 102 (6), 870–877, doi:10.3732/ajb.1400352.
DeCarlo, T. M. et al., 2019: Acclimatization of massive reef-building corals to consecutive heatwaves. Proceedings. Biological sciences, 286 (1898), 20190235, doi:10.1098/rspb.2019.0235.
Dobson, A. P. et al., 2020: Ecology and economics for pandemic prevention. Science, 369 (6502), 379–381, doi:10.1126/science.abc3189.
Doney, S. C. et al., 2012: Climate change impacts on marine ecosystems. Annual Review of Marine Science, 4, 11–37, doi:10.1146/annurev-marine-041911-111611.
Donovan, M. K. et al., 2021: Local conditions magnify coral loss after marine heatwaves. Science, 372 (6545), 977–980, doi:10.1126/science.abd9464.
Dudgeon, D. et al., 2006: Freshwater biodiversity: importance, threats, status and conservation challenges. Biological Reviews, 81 (2), 163–182, doi:10.1017/s1464793105006950.
Dueñas, M.-A., D. J. Hemming, A. Roberts and H. Diaz-Soltero, 2021: The threat of invasive species to IUCN-listed critically endangered species: A systematic review. Global Ecology and Conservation, 26, e01476, doi:10.1016/j.gecco.2021.e01476.
Duffy, J. E. et al., 2016: Biodiversity enhances reef fish biomass and resistance to climate change. Proceedings of the National Academy of Science (USA) , 113 (22), 6230–6235, doi:10.1073/pnas.1524465113.
Enquist, B. J. et al., 2019: The commonness of rarity: Global and future distribution of rarity across land plants. Science Advances, 5 (11), eaaz0414, doi:10.1126/sciadv.aaz0414.
Farashi, A. and M. Erfani, 2018: Modeling of habitat suitability of Asiatic black bear (Ursus thibetanus gedrosianus) in Iran in future. Acta Ecologica Sinica, 38 (1), 9–14, doi:10.1016/j.chnaes.2017.07.003.
Fernandes, G. W. et al., 2018: The deadly route to collapse and the uncertain fate of Brazilian rupestrian grasslands. Biodiversity and Conservation, 27 (10), 2587–2603, doi:10.1007/s10531-018-1556-4.
Ferreira, M. T. et al., 2019: Implications of climate change to the design of protected areas: The case study of small islands (Azores). PLOS ONE, 14 (6), e0218168, doi:10.1371/journal.pone.0218168.
Fick, S. E. and R. J. Hijmans, 2017: WorldClim 2: new 1-km spatial resolution climate surfaces for global land areas. International Journal of Climatology, 37 (12), 4302–4315, doi:10.1002/joc.5086.
Fischlin, A. et al., 2007: Ecosystems their properties goods and services. In: Climate Change 2007: Impacts, Adaptation and Vulnerability. Contribution of Working Group II to the Fourth Assessment Report of the Intergovernmental Panel on Climate Change[Parry, M. L., O. F. Canziani, J. P. Palutikof, P. J. v. d. Linden and C. E. Hanson (eds.)]. Cambridge University Press, Cambridge, pp. 211–272.
Flousek, J., T. Telenský, J. Hanzelka and J. Reif, 2015: Population Trends of Central European Montane Birds Provide Evidence for Adverse Impacts of Climate Change on High-Altitude Species. PLOS ONE, 10 (10), e0139465, doi:10.1371/journal.pone.0139465.
Foden, W. B. et al., 2013: Identifying the world’s most climate change vulnerable species: A systematic trait-based assessment of all birds, amphibians and corals. PLOS ONE, 8 (6), e65427, doi:10.1371/journal.pone.0065427.
Fontúrbel, F. E., A. Lara, D. Lobos and C. Little, 2018: The cascade impacts of climate change could threaten key ecological interactions. Ecosphere, 9 (12), e02485, doi:10.1002/ecs2.2485.
Fortini, L. B. et al., 2015: Large-Scale Range Collapse of Hawaiian Forest Birds under Climate Change and the Need 21st Century Conservation Options. PLOS ONE, 10 (10), e0140389, doi:10.1371/journal.pone.0140389.
Fossheim, M. et al., 2015: Recent warming leads to a rapid borealization of fish communities in the Arctic. Nature Climate Change, 5, 673, doi:10.1038/nclimate2647.
Foster, G. L., P. Hull, D. J. Lunt and J. C. Zachos, 2018: Placing our current ‘hyperthermal’ in the context of rapid climate change in our geological past. Philosophical Transactions of the Royal Society A, 376 (2130), 20170086, doi:10.1098/rsta.2017.0086.
Frederico, R. G., J. D. Olden and J. Zuanon, 2016: Climate change sensitivity of threatened, and largely unprotected, Amazonian fishes. Aquatic Conservation: Marine and Freshwater Ecosystems, 26 (S1), 91–102, doi:10.1002/aqc.2658.
Freeman, B. G., M. N. Scholer, V. Ruiz-Gutierrez and J. W. Fitzpatrick, 2018: Climate change causes upslope shifts and mountaintop extirpations in a tropical bird community. Proceedings of the National Academy of Sciences, 115 (47), 11982–11987, doi:10.1073/pnas.1804224115.
Fuchs, H. L. et al., 2020: Wrong-way migrations of benthic species driven by ocean warming and larval transport. Nature Climate Change, 10, 1052–1056, doi:10.1038/s41558-020-0894-x.
Fulton, G. R., 2017: The Bramble Cay melomys: the first mammalian extinction due to human-induced climate change. Pacific Conservation Biology, 23 (1), 1–3, doi:10.1071/PCV23N1_ED.
Gallagher, R. V., L. Hughes and M. R. Leishman, 2009: Phenological trends among Australian alpine species: using herbarium records to identify climate-change indicators. Australian Journal of Botany, 57 (1), 1–9, doi:10.1071/BT08051.
Gann, G. D. et al., 2019: International principles and standards for the practice of ecological restoration. Second edition. Restoration Ecology, 27 (S1), S1-S46, doi:10.1111/rec.13035.
Garcia, J. et al., 2014: Intake, grazing time and performance of steers supplemented in Brachiaria decumbens pastures during the dry season. Semina: Ciências Agrárias, 35 (4), 2095–2106, doi:10.5433/1679-0359.2014v35n4p2095.
García Molinos, J. et al., 2016: Climate velocity and the future global redistribution of marine biodiversity. Nature Climate Change, 6 (1), 83–88, doi:10.1038/nclimate2769.
García Molinos, J., D. S. Schoeman, C. J. Brown and M. T. Burrows, 2019: VoCC: An r package for calculating the velocity of climate change and related climatic metrics. Methods in Ecology and Evolution, 10 (12), 2195–2202, doi:10.1111/2041-210X.13295.
Gattuso, J.-P. et al., 2015: Contrasting futures for ocean and society from different anthropogenic CO2 emissions scenarios. Science, 349 (6243), doi:10.1126/science.aac4722.
Ghulam, A., 2014: Monitoring tropical forest degradation in Betampona Nature Reserve, Madagascar using multisource remote sensing data fusion. IEEE Journal of Selected Topics in Applied Earth Observations and Remote Sensing, 7 (12), 4960–4971, doi:10.1109/JSTARS.2014.2319314.
Givan, O., D. Edelist, O. Sonin and J. Belmaker, 2018: Thermal affinity as the dominant factor changing Mediterranean fish abundances. Global Change Biology, 24 (1), e80-e89, doi:10.1111/gcb.13835.
Goldstein, A. et al., 2020: Protecting irrecoverable carbon in Earth’s ecosystems. Nature Climate Change, 10 (4), 287–295, doi:10.1038/s41558-020-0738-8.
González-Orozco, C. E. et al., 2016: Phylogenetic approaches reveal biodiversity threats under climate change. Nature Climate Change, 6, 1110, doi:10.1038/nclimate3126.
Goulding, W., P. T. Moss and C. A. McAlpine, 2016: Cascading effects of cyclones on the biodiversity of Southwest Pacific islands. Biological Conservation, 193, 143–152, doi:10.1016/j.biocon.2015.11.022.
Grabowski, M. M. et al., 2013: Do Arctic-nesting birds respond to earlier snowmelt? A multi-species study in north Yukon, Canada. Polar Biology, 36 (8), 1097–1105, doi:10.1007/s00300-013-1332-6.
Grafton, R. Q. et al., 2013: Global insights into water resources, climate change and governance. Nature Climate Change, 3, 315–321, doi:10.1038/nclimate1746.
Grebmeier, J. M., K. E. Frey, L. W. Cooper and M. Kędra, 2018: Trends in benthic macrofaunal populations, seasonal sea ice persistence, and bottom water temperatures in the Bering Strait region. Oceanography, 31 (2), 136–151, doi:10.5670/oceanog.2018.224.
Grenyer, R. et al., 2006: Global distribution and conservation of rare and threatened vertebrates. Nature, 444 (7115), 93–96, doi:10.1038/nature05237.
Griffiths, H. J., A. J. S. Meijers and T. J. Bracegirdle, 2017: More losers than winners in a century of future Southern Ocean seafloor warming. Nature Climate Change, 7, 749, doi:10.1038/nclimate3377.
Gruber, N. et al., 2012: Rapid Progression of Ocean Acidification in the California Current System. Science, 337 (6091), 220–223, doi:10.1126/science.1216773.
Gudmundsson, L., S. I. Seneviratne and X. Zhang, 2017: Anthropogenic climate change detected in European renewable freshwater resources. Nature Climate Change, 7 (11), 813–816, doi:10.1038/nclimate3416.
Halpern, B. S. et al., 2015: Spatial and temporal changes in cumulative human impacts on the world’s ocean. Nature Communications, 6, 7615, doi:10.1038/ncomms8615.
Halpern, B. S. et al., 2008: A global map of human impact on marine ecosystems. Science, 319 (5865), 948–952, doi:10.1126/science.1149345.
Hannah, L. et al., 2020: 30% land conservation and climate action reduces tropical extinction risk by more than 50%. Ecography, 43 (7), 943–953, doi:10.1111/ecog.05166.
Harris, I., T. J. Osborn, P. Jones and D. Lister, 2020: Version 4 of the CRU TS monthly high-resolution gridded multivariate climate dataset. Scientific Data, 7 (1), 109, doi:10.1038/s41597-020-0453-3.
Harrison, I. et al., 2018: The freshwater biodiversity crisis. Science, 362 (6421), 1369–1369, doi:10.1126/science.aav9242.
Harter, D. E. V. et al., 2015: Impacts of global climate change on the floras of oceanic islands – Projections, implications and current knowledge. Perspectives in Plant Ecology, Evolution and Systematics, 17 (2), 160–183, doi:10.1016/j.ppees.2015.01.003.
Heikkinen, R. K. et al., 2020: Fine-grained climate velocities reveal vulnerability of protected areas to climate change. Scientific Reports, 10 (1), 1678, doi:10.1038/s41598-020-58638-8.
Hermes, C., G. Segelbacher and H. M. Schaefer, 2018: A framework for prioritizing areas for conservation in tropical montane cloud forests. Écoscience, 25 (1), 97–108, doi:10.1080/11956860.2017.1419787.
Herrera, J., A. Solari and L. O. Lucifora, 2015: Unanticipated effect of climate change on an aquatic top predator of the Atlantic rainforest. Aquatic Conservation: Marine and Freshwater Ecosystems, 25 (6), 817–828, doi:10.1002/aqc.2536.
Hidasi-Neto, J. et al., 2019: Climate change will drive mammal species loss and biotic homogenization in the Cerrado Biodiversity Hotspot. Perspectives in Ecology and Conservation, 17 (2), 57–63, doi:10.1016/j.pecon.2019.02.001.
Hobday, A. J. et al., 2018: Categorizing and naming marine heatwaves. Oceanography, 31 (2), 162–173, doi:10.5670/oceanog.2018.205.
Hoffmann, A. A. et al., 2019: Impacts of recent climate change on terrestrial flora and fauna: Some emerging Australian examples. Austral Ecol. , 44 (1), 3–27, doi:10.1111/aec.12674.
Holmes, I., K. McLaren and B. Wilson, 2015: Niche modeling for management-ready information in little-studied, threatened frog species assemblages. Journal for Nature Conservation, 28, 26–34, doi:10.1016/j.jnc.2015.08.005.
Hughes, L., A. Dean, W. Steffen and M. Rice, 2019a: This is what climate change looks like. Climate Council of Australia. Available at: https://www.climatecouncil.org.au/wp-content/uploads/2019/09/This-is-What-Climate-Change-Looks-Like.pdf.
Hughes, T. P. et al., 2018a: Spatial and temporal patterns of mass bleaching of corals in the Anthropocene. Science, 359 (6371), 80–83, doi:10.1126/science.aan8048.
Hughes, T. P. et al., 2019b: Global warming impairs stock–recruitment dynamics of corals. Nature, 568 (7752), 387–390, doi:10.1038/s41586-019-1081-y.
Hughes, T. P. et al., 2018b: Global warming transforms coral reef assemblages. Nature, 556 (7702), 492–496, doi:10.1038/s41586-018-0041-2.
Huntley, B. and P. Barnard, 2012: Potential impacts of climatic change on southern African birds of fynbos and grassland biodiversity hotspots. Diversity and Distributions, 18 (8), 769–781, doi:10.1111/j.1472-4642.2012.00890.x.
Ibisch, P. L. et al., 2016: A global map of roadless areas and their conservation status. Science, 354 (6318), 1423–1427, doi:doi:10.1126/science.aaf7166.
IPCC, 2007: Climate Change 2007: Impacts, Adaptation and Vulnerability. Contribution of Working Group II to the Fourth Assessment Report of the Intergovernmental Panel on Climate Change. Cambridge University Press, Cambridge, 1000 pp.
IPCC, 2014: Climate Change 2014: Impacts, Adaptation, and Vulnerability. Part A: Global and Sectoral Aspects. Contribution of Working Group II to the Fifth Assessment Report of the Intergovernmental Panel on Climate Change. Cambridge University Press, Cambridge, UK, 1132 pp.
IPCC, 2018: Global warming of 1.5°C. An IPCC Special Report on the impacts of global warming of 1.5°C above pre-industrial levels and related global greenhouse gas emission pathways, in the context of strengthening the global response to the threat of climate change, sustainable development, and efforts to eradicate poverty[Masson-Delmotte, V., P. Zhai, H.-O. Pörtner, D. Roberts, J. Skea, P. R. Shukla, A. Pirani, W. Moufouma-Okia, C. Péan, R. Pidcock, S. Connors, J. B. R. Matthews, Y. Chen, X. Zhou, M. I. Gomis, E. Lonnoy, T. Maycock, M. Tignor and T. Waterfield (eds.)]. IPCC Special Report.
IPCC, 2019a: Climate Change and Land: An IPCC special report on climate change, desertification, land degradation, sustainable land management, food security, and greenhouse gas fluxes in terrestrial ecosystems (SRCCL). In: Climate Change and Land: an IPCC special report on climate change, desertification, land degradation, sustainable land management, food security, and greenhouse gas fluxes in terrestrial ecosystems (SRCCL) [Shukla, P. R., J. Skea, E. Calvo Buendia, V. Masson-Delmotte, H.-O. Pörtner, D. C. Roberts, P. Zhai, R. Slade, S. Connors, R. van Diemen, M. Ferrat, E. Haughey, S. Luz, S. Neogi, M. Pathak, J. Petzold, J. Portugal Pereira, P. Vyas, E. Huntley, K. Kissick, M. Belkacemi and J. Malley (eds.)]. IPCC with World Meteorological Organisation (WMO), and United Nations Environmental Program (UNEP), Geneva, Switzerland, pp. 1542, In press.
IPCC, 2019b: Summary for Policymakers. In: IPCC Special Report on the Ocean and Cryosphere in a Changing Climate[H.-O. Pörtner, D. C. R., V. Masson-Delmotte, P. Zhai, M. Tignor, E. Poloczanska, K. Mintenbeck, M. Nicolai, A. Okem, J. Petzold, B. Rama, N. Weyer (ed.)], pp. in press. ISBN 1354-1013.
Isbell, F. et al., 2015: Biodiversity increases the resistance of ecosystem productivity to climate extremes. Nature, 526, 574, doi:10.1038/nature15374.
James, C. S. et al., 2017: Sink or swim? Potential for high faunal turnover in Australian rivers under climate change. Journal of Biogeography, 44 (3), 489–501, doi:10.1111/jbi.12926.
Janse, J. H. et al., 2015: GLOBIO-Aquatic, a global model of human impact on the biodiversity of inland aquatic ecosystems. Environmental Science & Policy, 48, 99–114, doi:10.1016/j.envsci.2014.12.007.
Jarić, I. et al., 2019: Susceptibility of European freshwater fish to climate change: Species profiling based on life-history and environmental characteristics. Global Change Biology, 25 (2), 448–458, doi:10.1111/gcb.14518.
Jefferson, T. and M. J. Costello, 2019: Hotspots of marine biodiversity. In: Reference Module in Earth Systems and Environmental Sciences. Elsevier. ISBN 978-0-12-409548-9.
Jenouvrier, S. et al., 2014: Projected continent-wide declines of the emperor penguin under climate change. Nature Climate Change, 4 (8), 715–718, doi:10.1038/nclimate2280.
Jézéquel, C. et al., 2020: Freshwater fish diversity hotspots for conservation priorities in the Amazon Basin. Conservation Biology, 34 (4), 956–965, doi:10.1111/cobi.13466.
Jones, M. C. and W. W. L. Cheung, 2015: Multi-model ensemble projections of climate change effects on global marine biodiversity. ICES Journal of Marine Science, 72 (3), 741–752, doi:10.1093/icesjms/fsu172.
Jonsson, P. R. et al., 2018: High climate velocity and population fragmentation may constrain climate-driven range shift of the key habitat former Fucus vesiculosus. Diversity and Distributions, 24 (7), 892–905, doi:10.1111/ddi.12733.
Jorda, G. et al., 2020: Ocean warming compresses the three-dimensional habitat of marine life. Nature Ecology & Evolution, 4 (1), 109–114, doi:10.1038/s41559-019-1058-0.
Jung, M. et al., 2021: Areas of global importance for conserving terrestrial biodiversity, carbon and water. Nature Ecology & Evolution, 4, 1499–1509, doi:10.1038/s41559-021-01528-7.
Keppel, G., C. Morrison, J.-Y. Meyer and H. J. Boehmer, 2014: Isolated and vulnerable: the history and future of Pacific Island terrestrial biodiversity. Pacific Conservation Biology, 20 (2), 136–145, doi:10.1071/PC140136.
Khormi, H. M. and L. Kumar, 2014: Climate change and the potential global distribution of Aedes aegypti: spatial modelling using GIS and CLIMEX. Geospat Health, 8 (2), 405–415, doi:10.4081/gh.2014.29.
Kidane, Y. O., M. J. Steinbauer and C. Beierkuhnlein, 2019: Dead end for endemic plant species? A biodiversity hotspot under pressure. Global Ecology and Conservation, 19, e00670, doi:10.1016/j.gecco.2019.e00670.
Kiessling, W. et al., 2012: Equatorial decline of reef corals during the last Pleistocene interglacial. Proceedings of the National Academy of Sciences of the United States of America, 109 (52), 21378–21383, doi:10.1073/pnas.1214037110.
King, A. D., D. J. Karoly and B. J. Henley, 2017: Australian climate extremes at 1.5°C and 2°C of global warming. Nature Climate Change, 7 (6), 412–416, doi:10.1038/nclimate3296.
Kjesbu, O. S. et al., 2014: Synergies between climate and management for Atlantic cod fisheries at high latitudes. Proceedings of the National Academy of Sciences, 111 (9), 3478–3483, doi:10.1073/pnas.1316342111.
Kleypas, J. et al., 2021: Designing a blueprint for coral reef survival. Biological Conservation, 257, 109107, doi:10.1016/j.biocon.2021.109107.
Knouft, J. H. and D. L. Ficklin, 2017: The Potential Impacts of Climate Change on Biodiversity in Flowing Freshwater Systems. Annual Review of Ecology, Evolution, and Systematics, 48 (1), 111–133, doi:10.1146/annurev-ecolsys-110316-022803.
Kocsis, Á. T., Q. Zhao, M. J. Costello and W. Kiessling, 2021: Not all biodiversity richspots are climate refugia. Biogeosciences Discussions, 2021, 1–18, doi:10.5194/bg-2021-179.
Koenigstein, S. et al., 2018: Forecasting future recruitment success for Atlantic cod in the warming and acidifying Barents Sea. Global Change Biology, 24 (1), 526–535, doi:10.1111/gcb.13848.
Koide, D., K. Yoshida, C. C. Daehler and D. Mueller-Dombois, 2017: An upward elevation shift of native and non-native vascular plants over 40 years on the island of Hawai’i. Journal of Vegetation Science, 28 (5), 939–950, doi:10.1111/jvs.12549.
Kortsch, S. et al., 2012: Climate-driven regime shifts in Arctic marine benthos. Proceedings of the National Academy of Sciences, 109 (35), 14052–14057, doi:10.1073/pnas.1207509109.
Kuhlmann, M., D. Guo, R. Veldtman and J. Donaldson, 2012: Consequences of warming up a hotspot: species range shifts within a centre of bee diversity. Diversity and Distributions, 18 (9), 885–897, doi:10.1111/j.1472-4642.2011.00877.x.
Kumagai, N. H. et al., 2018: Ocean currents and herbivory drive macroalgae-to-coral community shift under climate warming. Proceedings of the National Academy of Sciences, 115, 8990–8995, doi:10.1073/pnas.1716826115.
Laffoley, D. D. A. and J. Baxter, 2016: Explaining ocean warming: Causes, scale, effects and consequences. IUCN Gland, Switzerland. ISBN 2831718066.
Lamsal, P., L. Kumar and K. Atreya, 2017: Historical evidence of climatic variability and changes, and its effect on high-altitude regions: insights from Rara and Langtang, Nepal. International Journal of Sustainable Development & World Ecology, 24 (6), 471–484, doi:10.1080/13504509.2016.1198939.
Lanzante, J. R. et al., 2018: Some Pitfalls in Statistical Downscaling of Future Climate. Bulletin of the American Meteorological Society, 99 (4), 791–803, doi:10.1175/BAMS-D-17-0046.1.
Larsen, J. N. et al., 2014: Polar regions. In: Climate Change 2014: Impacts, Adaptation, and Vulnerability. Part B: Regional Aspects. Contribution of Working Group II to the Fifth Assessment Report of the Intergovernmental Panel on Climate Change[Field, C. B., V. R. Barros, D. J. Dokken, K. J. Mach, M. D. Mastrandrea, T. E. Bilir, M. Chatterjee, K. L. Ebi, Y. O. Estrada, R. C. Genova, B. Girma, E. S. Kissel, A. N. Levy, S. MacCracken, P. R. Mastrandrea and L. L. White (eds.)]. Cambridge University Press, Cambridge UK and New York, NY, USA.
Laverick, J. H. and A. D. Rogers, 2019: Mesophotic Coral Ecosystems. In: Reference Module in Earth Systems and Environmental Sciences. Elsevier. ISBN 978-0-12-409548-9.
Le Roux, J. J. et al., 2019: Recent Anthropogenic Plant Extinctions Differ in Biodiversity Hotspots and Coldspots. Current Biology, 29 (17), 2912–2918.e2912, doi:10.1016/j.cub.2019.07.063.
Lee, A. T. K. and P. Barnard, 2016: Endemic birds of the Fynbos biome: a conservation assessment and impacts of climate change. Bird Conservation International, 26 (1), 52–68, doi:10.1017/S0959270914000537.
Lenoir, J. et al., 2020: Species better track climate warming in the oceans than on land. Nature Ecology & Evolution, 4 (1044–1059), doi:10.1038/s41559-020-1198-2.
Lenoir, J. and J. C. Svenning, 2015: Climate-related range shifts – a global multidimensional synthesis and new research directions. Ecography, 38 (1), 15–28, doi:10.1111/ecog.00967.
Leroy, B. et al., 2019: Global biogeographical regions of freshwater fish species. Journal of Biogeography, NA (0), doi:10.1111/jbi.13674.
Lima, A. A. d., M. C. Ribeiro, C. E. d. V. Grelle and M. P. Pinto, 2019: Impacts of climate changes on spatio-temporal diversity patterns of Atlantic Forest primates. Perspectives in Ecology and Conservation, 17 (2), 50–56, doi:10.1016/j.pecon.2019.04.004.
Loarie, S. R. et al., 2009: The velocity of climate change. Nature, 462 (7276), 1052–1055.
Lourenço-de-Moraes, R. et al., 2019: Climate change will decrease the range size of snake species under negligible protection in the Brazilian Atlantic Forest hotspot. Scientific Reports, 9 (1), 8523, doi:10.1038/s41598-019-44732-z.
Lovelock, C. E. and R. Reef, 2020: Variable Impacts of Climate Change on Blue Carbon. One Earth, 3 (2), 195–211, doi:10.1016/j.oneear.2020.07.010.
Loyola, R. D. et al., 2014: Clade-specific consequences of climate change to amphibians in Atlantic Forest protected areas. Ecography, 37 (1), 65–72, doi:10.1111/j.1600-0587.2013.00396.x.
Lozano, O. M. et al., 2017: Assessing climate change impacts on wildfire exposure in Mediterranean areas. Risk Analysis, 37 (10), 1898–1916, doi:10.1111/risa.12739.
Luke, D., K. McLaren and B. Wilson, 2016: Short-term Dynamics and the Effects of Biotic and Abiotic Factors on Plant Physiognomic Groups in a Hurricane-impacted Lower Montane Tropical Forest. Biotropica, 48 (3), 332–341, doi:10.1111/btp.12288.
Ma, W. et al., 2016: Fundamental shifts of central hardwood forests under climate change. Ecological Modelling, 332, 28–41, doi:10.1016/j.ecolmodel.2016.03.021.
Mackey, B. et al., 2020: Understanding the importance of primary tropical forest protection as a mitigation strategy. Mitig Adapt Strateg Glob Change, 25 (5), 763–787, doi:10.1007/s11027-019-09891-4.
Maharaj, S. et al., 2018: Assessing protected area effectiveness within the Caribbean under changing climate conditions: A case study of the small island, Trinidad. Land Use Policy, 81, 185–193.
Maharaj, S. S. and M. New, 2013: Modelling individual and collective species responses to climate change within Small Island States. Biological Conservation, 167, 283–291, doi:10.1016/j.biocon.2013.08.027.
Manes, S. et al., 2021: Endemism increases species’ climate change risk in areas of global biodiversity importance. Biological Conservation, 257, 109070, doi:10.1016/j.biocon.2021.109070.
Mantyka-Pringle, C. S. et al., 2015: Climate change modifies risk of global biodiversity loss due to land-cover change. Biological Conservation, 187, 103–111, doi:10.1016/j.biocon.2015.04.016.
Mariani, G. et al., 2020: Let more big fish sink: Fisheries prevent blue carbon sequestration—half in unprofitable areas. Science Advances, 6 (44), eabb4848, doi:10.1126/sciadv.abb4848.
Markovic, D. et al., 2014: Europe’s freshwater biodiversity under climate change: distribution shifts and conservation needs. Diversity and Distributions, 20 (9), 1097–1107, doi:10.1111/ddi.12232.
Marler, T. E., 2014: Pacific island tropical cyclones are more frequent and globally relevant, yet less studied. Frontiers in Environmental Science, 2 (42), doi:10.3389/fenvs.2014.00042.
McGuire, J. L. et al., 2016: Achieving climate connectivity in a fragmented landscape. Proceedings of the National Academy of Sciences, 113 (26), 7195–7200, doi:10.1073/pnas.1602817113.
McKelvy, A. and F. Burbrink, 2017: Ecological divergence in the yellow-bellied kingsnake (Lampropeltis calligaster) at two North American biodiversity hotspots. Molecular Phylogenetics and Evolution, 106, 61–72, doi:10.1016/j.ympev.2016.09.006.
McManus, L. C. et al., 2020: Extreme temperature events will drive coral decline in the Coral Triangle. Global Change Biology, 26 (4), 2120–2133, doi:10.1111/gcb.14972.
McPherson, M. L. et al., 2021: Large-scale shift in the structure of a kelp forest ecosystem co-occurs with an epizootic and marine heatwave. Communications Biology, 4 (1), 298, doi:10.1038/s42003-021-01827-6.
Mechler, R. et al., 2020: Loss and Damage and limits to adaptation: recent IPCC insights and implications for climate science and policy. Sustainability Science, 15 (4), 1245–1251, doi:10.1007/s11625-020-00807-9.
Médail, F., 2017: The specific vulnerability of plant biodiversity and vegetation on Mediterranean islands in the face of global change. Regional Environmental Change, 17 (6), 1775–1790, doi:10.1007/s10113-017-1123-7.
Mendoza-Ponce, A. et al., 2018: Identifying effects of land use cover changes and climate change on terrestrial ecosystems and carbon stocks in Mexico. Global Environmental Change, 53, 12–23, doi:10.1016/j.gloenvcha.2018.08.004.
Mendoza-Ponce, A., R. O. Corona-Núñez, L. Galicia and F. Kraxner, 2019: Identifying hotspots of land use cover change under socioeconomic and climate change scenarios in Mexico. Ambio, 48 (4), 336–349, doi:10.1007/s13280-018-1085-0.
Mittermeier, R. A. et al., 2004: Hotspots revisited. Cemex, Mexico City, 392 pp. ISBN 9686397779.
Mittermeier, R. A. et al., 2011: Global biodiversity conservation: The critical role of hotspots. In: Biodiversity Hotspots: Distribution and Protection of Conservation Priority Areas[Zachos, F. E. and J. C. Habel (eds.)]. Springer Berlin Heidelberg, Berlin, Heidelberg, pp. 3–22. ISBN 978-3-642-20992-5.
Molina-Martínez, A. et al., 2016: Changes in butterfly distributions and species assemblages on a Neotropical mountain range in response to global warming and anthropogenic land use. Diversity and Distributions, 22 (11), 1085–1098, doi:10.1111/ddi.12473.
Moret, P., M. d. l. Á. Aráuz, M. Gobbi and Á. Barragán, 2016: Climate warming effects in the tropical Andes: first evidence for upslope shifts of Carabidae (Coleoptera) in Ecuador. Insect Conservation and Diversity, 9 (4), 342–350, doi:10.1111/icad.12173.
Moss, B. et al., 2009: Climate change and the future of freshwater biodiversity in Europe: a primer for policy-makers. Freshwater Reviews, 2 (2), 103–131, doi:10.1608/FRJ-2.2.1.
Mueter, F. J. and M. A. Litzow, 2008: Sea ice retreat alters the biogeography of the Bering Sea continental shelf. Ecological Applications, 18 (2), 309–320, doi:10.1890/07-0564.1.
Muir, P. R., C. C. Wallace, T. Done and J. D. Aguirre, 2015: Limited scope for latitudinal extension of reef corals. Science, 348 (6239), 1135–1138, doi:10.1126/science.1259911.
Myers, N. et al., 2000: Biodiversity hotspots for conservation priorities. Nature, 403 (6772), 853–858, doi:10.1038/35002501.
Narins, P. M. and S. W. F. Meenderink, 2014: Climate change and frog calls: long-term correlations along a tropical altitudinal gradient. Proceedings of the Royal Society B: Biological Sciences, 281 (1783), 20140401, doi:doi:10.1098/rspb.2014.0401.
Nghikembua, M., J. Harris, T. Tregenza and L. Marker, 2016: Spatial and Temporal Habitat Use by GPS Collared Male Cheetahs in Modified Bushland Habitat. Open Journal of Forestry, 6 (4) , 12, doi:10.4236/ojf.2016.64022.
Noss, R. F. et al., 2015: How global biodiversity hotspots may go unrecognized: lessons from the North American Coastal Plain. Diversity and Distributions, 21 (2), 236–244, doi:10.1111/ddi.12278.
Oliver, E. C. J. et al., 2018: Longer and more frequent marine heatwaves over the past century. Nature Communications, 9 (1), 1324, doi:10.1038/s41467-018-03732-9.
Olson, D. M. and E. Dinerstein, 2002: The Global 200: Priority ecoregions for global conservation. Annals of the Missouri Botanical garden, 89 (2), 199–224, doi:10.2307/3298564.
Padalia, H., V. Srivastava and S. P. S. Kushwaha, 2015: How climate change might influence the potential distribution of weed, bushmint (Hyptis suaveolens)?Environmental Monitoring and Assessment , 187 (4), 210, doi:10.1007/s10661-015-4415-8.
Pecl, G. T. et al., 2017: Biodiversity redistribution under climate change: Impacts on ecosystems and human well-being. Science, 355 (6332), doi:10.1126/science.aai9214.
Pérez-García, N., X. Font, A. Ferré and J. Carreras, 2013: Drastic reduction in the potential habitats for alpine and subalpine vegetation in the Pyrenees due to twenty-first-century climate change. Regional Environmental Change, 13 (6), 1157–1169, doi:10.1007/s10113-013-0427-5.
Perry, C. T. et al., 2018: Loss of coral reef growth capacity to track future increases in sea level. Nature, 558 (7710), 396–400, doi:10.1038/s41586-018-0194-z.
Perry, G. L., J. M. Wilmshurst and M. S. McGlone, 2014: Ecology and long-term history of fire in New Zealand. New Zealand Journal of Ecology, 38 (2), 1.
Pershing, A. J. et al., 2015: Slow adaptation in the face of rapid warming leads to collapse of the Gulf of Maine cod fishery. Science, 350 (6262), 809–812, doi:10.1126/science.aac9819.
Petzold, J. and A. K. Magnan, 2019: Climate change: thinking small islands beyond Small Island Developing States (SIDS). Climatic Change, 152 (1), 145–165, doi:10.1007/s10584-018-2363-3.
Pinsky, M. L. et al., 2019: Greater vulnerability to warming of marine versus terrestrial ectotherms. Nature, 569 (7754), 108–111, doi:10.1038/s41586-019-1132-4.
Pinsky, M. L. et al., 2013: Marine taxa track local climate velocities. Science, 341 (6151), 1239–1242, doi:10.1126/science.1239352.
Poloczanska, E. S. et al., 2013: Global imprint of climate change on marine life. Nature Climate Change, 3, 919–925, doi:10.1038/nclimate1958.
Poloczanska, E. S. et al., 2016: Responses of marine organisms to climate change across oceans. Frontiers in Marine Science, 3 (62), doi:10.3389/fmars.2016.00062.
Pörtner, H.-O. et al., 2021: IPBES-IPCC co-sponsored workshop report on biodiversity and climate change. IPBES secretariat, Bonn, Germany,. Available at: https://zenodo.org/record/4923212/export/hx (accessed 2021/06/10/16:24:01).
Poulsen, Z. C. and M. T. Hoffman, 2015: Changes in the distribution of indigenous forest in Table Mountain National Park during the 20th Century. South African Journal of Botany, 101, 49–56, doi:10.1016/j.sajb.2015.05.002.
Pounds, J. A., M. P. L. Fogden and J. H. Campbell, 1999: Biological response to climate change on a tropical mountain. Nature, 398 (6728), 611–615, doi:10.1038/19297.
Pouteau, R. and P. Birnbaum, 2016: Island biodiversity hotspots are getting hotter: vulnerability of tree species to climate change in New Caledonia. Biological Conservation, 201, 111–119, doi:10.1016/j.biocon.2016.06.031.
Pritchard, H. D., 2019: Asia’s shrinking glaciers protect large populations from drought stress. Nature, 569 (7758), 649–654, doi:10.1038/s41586-019-1240-1.
Priti, H., N. A. Aravind, R. Uma Shaanker and G. Ravikanth, 2016: Modeling impacts of future climate on the distribution of Myristicaceae species in the Western Ghats, India. Ecological Engineering, 89, 14–23, doi:10.1016/j.ecoleng.2016.01.006.
Ramírez-Amezcua, Y., V. W. Steinmann, E. Ruiz-Sanchez and O. R. Rojas-Soto, 2016: Mexican alpine plants in the face of global warming: potential extinction within a specialized assemblage of narrow endemics. Biodiversity and conservation, 25 (5), 865–885, doi:10.1007/s10531-016-1094-x.
Ramírez, F., I. Afán, L. S. Davis and A. Chiaradia, 2017: Climate impacts on global hot spots of marine biodiversity. Science Advances, 3 (2), e1601198, doi:10.1126/sciadv.1601198.
Ramírez, F. et al., 2018: Spatial congruence between multiple stressors in the Mediterranean Sea may reduce its resilience to climate impacts. Scientific Reports, 8 (1), 14871, doi:10.1038/s41598-018-33237-w.
Rathore, P., A. Roy and H. Karnatak, 2019: Modelling the vulnerability of Taxus wallichiana to climate change scenarios in South East Asia. Ecological Indicators, 102, 199–207, doi:10.1016/j.ecolind.2019.02.020.
Rayner, N. A. et al., 2003: Global analyses of sea surface temperature, sea ice, and night marine air temperature since the late nineteenth century. Journal of Geophysical Research: Atmospheres, 108 (D14), doi:10.1029/2002JD002670.
Richardson, B., M. Richardson and G. González, 2018: Responses of two litter-based invertebrate communities to changes in canopy cover in a forest subject to hurricanes. Forests, 9 (6), 309, doi:10.3390/f9060309.
Rilov, G., 2016: Multi-species collapses at the warm edge of a warming sea. Scientific Reports, 6, 36897, doi:10.1038/srep36897.
Riordan, E. C. and P. W. Rundel, 2014: Land Use Compounds Habitat Losses under Projected Climate Change in a Threatened California Ecosystem. PLOS ONE, 9 (1), e86487, doi:10.1371/journal.pone.0086487.
Roberts, C. M. et al., 2017: Marine reserves can mitigate and promote adaptation to climate change. Proceedings of the National Academy of Sciences, 114 (24), 6167–6175, doi:10.1073/pnas.1701262114.
Robinson, S.-a., 2020a: Climate change adaptation in SIDS: A systematic review of the literature pre and post the IPCC Fifth Assessment Report. WIREs Climate Change, 11 (4), e653, doi:10.1002/wcc.653.
Robinson, S.-a., 2020b: A richness index for baselining climate change adaptations in small island developing states. Environmental and Sustainability Indicators, 8, 100065, doi:10.1016/j.indic.2020.100065.
Roehrdanz, P. R. and L. Hannah, 2016: Climate change, California wine, and wildlife habitat. Journal of Wine Economics, 11 (1), 69–87, doi:10.1017/jwe.2014.31.
Roycroft, E. et al., 2021: Museum genomics reveals the rapid decline and extinction of Australian rodents since European settlement. Proceedings of the National Academy of Sciences, 118 (27), e2021390118, doi:10.1073/pnas.2021390118.
Saintilan, N. et al., 2020: Thresholds of mangrove survival under rapid sea level rise. Science, 368 (6495), 1118–1121, doi:10.1126/science.aba2656.
Sala, E. et al., 2021: Protecting the global ocean for biodiversity, food and climate. Nature, 592 (7854), 397–402, doi:10.1038/s41586-021-03371-z.
Sánchez-Guillén, R. A. et al., 2013: Climate-induced range shifts and possible hybridisation consequences in insects. PLOS ONE, 8 (11), e80531, doi:10.1371/journal.pone.0080531.
Sandel, B. et al., 2011: The influence of late Quaternary climate-change velocity on species endemism. Science, 334 (6056), 660–664, doi:10.1126/science.1210173.
Sanford, E. et al., 2019: Widespread shifts in the coastal biota of northern California during the 2014–2016 marine heatwaves. Scientific Reports, 9 (1), 4216, doi:10.1038/s41598-019-40784-3.
Santangeli, A., O. Spiegel, P. Bridgeford and M. Girardello, 2018: Synergistic effect of land-use and vegetation greenness on vulture nestling body condition in arid ecosystems. Scientific Reports, 8 (1), 13027, doi:10.1038/s41598-018-31344-2.
Saunders, D. L., J. J. Meeuwig and A. C. J. Vincent, 2002: Freshwater protected areas: Strategies for conservation. Conservation Biology, 16 (1), 30–41, doi:10.1046/j.1523-1739.2002.99562.x.
Scheffers, B. R. et al., 2017: Vertical (arboreality) and horizontal (dispersal) movement increase the resilience of vertebrates to climatic instability. Global Ecology and Biogeography, 26 (7), 787–798, doi:10.1111/geb.12585.
Scheiter, S., S. I. Higgins, J. Beringer and L. B. Hutley, 2015: Climate change and long-term fire management impacts on Australian savannas. New Phytologist , 205 (3), 1211–1226, doi:10.1111/nph.13130.
Scobie, M., 2016: Policy coherence in climate governance in Caribbean Small Island Developing States. Environmental Science & Policy, 58, 16–28, doi:10.1016/j.envsci.2015.12.008.
Seim, A. et al., 2016: Climate change increases drought stress of juniper trees in the mountains of Central Asia. PLOS ONE, 11 (4), e0153888, doi:10.1371/journal.pone.0153888.
Shelton, J. M. et al., 2018: Vulnerability of Cape Fold Ecoregion freshwater fishes to climate change and other human impacts. Aquatic Conservation: Marine and Freshwater Ecosystems, 28 (1), 68–77, doi:10.1002/aqc.2849.
Shiels, A. B., G. González and M. R. Willig, 2014: Responses to canopy loss and debris deposition in a tropical forest ecosystem: Synthesis from an experimental manipulation simulating effects of hurricane disturbance. Forest Ecology and Management , 332, 124–133.
Shrestha, U. B. et al., 2018: Potential impact of climate change on the distribution of six invasive alien plants in Nepal. Ecological Indicators, 95, 99–107, doi:10.1016/j.ecolind.2018.07.009.
Silva-Rocha, I. et al., 2015: Snakes on the Balearic Islands: An Invasion Tale with Implications for Native Biodiversity Conservation. PLOS ONE, 10 (4), e0121026, doi:10.1371/journal.pone.0121026.
Sintayehu, D. W., 2018: Impact of climate change on biodiversity and associated key ecosystem services in Africa: a systematic review. Ecosystem Health and Sustainability, 4 (9), 225–239, doi:10.1080/20964129.2018.1530054.
Slatyer, R., 2010: Climate change impacts on Australia’s alpine ecosystems. The ANU Undergraduate Research Journal, 2, 1–17, doi:10.22459/aurj.02.2010.05.
Slingsby, J. A. et al., 2017: Intensifying postfire weather and biological invasion drive species loss in a Mediterranean-type biodiversity hotspot. Proc Natl Acad Sci U S A, 114 (18), 4697–4702, doi:10.1073/pnas.1619014114.
Song, J. and L. Duan, 2019: Chapter 18—The Yellow Sea. In: World Seas: an Environmental Evaluation (Second Edition) [Sheppard, C. (ed.)]. Academic Press, pp. 395–413. ISBN 978-0-08-100853-9.
Spatz, D. R. et al., 2017: Globally threatened vertebrates on islands with invasive species. Science Advances, 3 (10), e1603080, doi:10.1126/sciadv.1603080.
Sridhar, V. et al., 2014: CLIMEX simulated predictions of Oriental fruit fly, Bactrocera dorsalis (Hendel) (Diptera: Tephritidae) geographical distribution under climate change situations in India. Current Science, 106, 1702–1710.
Steinbauer, M. J. et al., 2018: Accelerated increase in plant species richness on mountain summits is linked to warming. Nature, 556, 231–234, doi:10.1038/s41586-018-0005-6.
Steneck, R. S. et al., 2002: Kelp forest ecosystems: biodiversity, stability, resilience and future. Environmental Conservation, 29 (4), 436–459.
Stevens, N., C. E. R. Lehmann, B. P. Murphy and G. Durigan, 2017: Savanna woody encroachment is widespread across three continents. Global Change Biology, 23 (1), 235–244, doi:10.1111/gcb.13409.
Stralberg, D. et al., 2015: Conservation of future boreal forest bird communities considering lags in vegetation response to climate change: a modified refugia approach. Diversity and Distributions, 21 (9), 1112–1128, doi:10.1111/ddi.12356.
Struebig, M. et al., 2015: Targeted conservation to safeguard a biodiversity hotspot from climate and land-cover change. Current Biology, 25 (3), 372–378, doi:10.1016/j.cub.2014.11.067.
Stuart-Smith, R. D., C. J. Brown, D. M. Ceccarelli and G. J. Edgar, 2018: Ecosystem restructuring along the Great Barrier Reef following mass coral bleaching. Nature, 560 (7716), 92–96, doi:10.1038/s41586-018-0359-9.
Stuart-Smith, R. D. et al., 2015: Thermal biases and vulnerability to warming in the world’s marine fauna. Nature, 528, 88, doi:10.1038/nature16144.
Stuart-Smith, R. D., G. J. Edgar and A. E. Bates, 2017: Thermal limits to the geographic distributions of shallow-water marine species. Nature Ecology & Evolution, 1 (12), 1846–1852, doi:10.1038/s41559-017-0353-x.
Su, G. et al., 2021: Human impacts on global freshwater fish biodiversity. Science, 371 (6531), 835–838, doi:10.1126/science.abd3369.
Sunday, J. M., A. E. Bates and N. K. Dulvy, 2012: Thermal tolerance and the global redistribution of animals. Nature Climate Change, 2 (9), 686–690.
Tang, C. Q. et al., 2017: Potential effects of climate change on geographic distribution of the Tertiary relict tree species Davidia involucrata in China. Scientific Reports, 7, 43822, doi:10.1038/srep43822.
Taylor, S. and L. Kumar, 2016: Global Climate Change Impacts on Pacific Islands Terrestrial Biodiversity: A Review. Tropical Conservation Science, 9 (1), 203–223, doi:10.1177/194008291600900111.
Teagle, H. and D. A. Smale, 2018: Climate-driven substitution of habitat-forming species leads to reduced biodiversity within a temperate marine community. Diversity and Distributions, 24 (10), 1367–1380, doi:10.1111/ddi.12775.
Tedesco, P. A. et al., 2013: A scenario for impacts of water availability loss due to climate change on riverine fish extinction rates. Journal of Applied Ecology, 50 (5), 1105–1115, doi:doi:10.1111/1365-2664.12125.
Tellería, J. L., 2020: Long-term altitudinal change in bird richness in a Mediterranean mountain range: habitat shifts explain the trends. Regional Environmental Change, 20 (2), 69, doi:10.1007/s10113-020-01657-y.
Telwala, Y., B. W. Brook, K. Manish and M. K. Pandit, 2013: Climate-induced elevational range shifts and increase in plant species richness in a himalayan biodiversity epicentre. PLOS ONE, 8 (2), e57103, doi:10.1371/journal.pone.0057103.
Terhaar, J., L. Kwiatkowski and L. Bopp, 2020: Emergent constraint on Arctic Ocean acidification in the twenty-first century. Nature, 582 (7812), 379–383, doi:10.1038/s41586-020-2360-3.
Thieme, M. L., B. Lehner, R. Abell and J. Matthews, 2010: Exposure of Africa’s freshwater biodiversity to a changing climate. Conservation Letters, 3 (5), 324–331, doi:10.1111/j.1755-263X.2010.00120.x.
Thomsen, M. S. et al., 2019: Local extinction of bull kelp (Durvillaea spp.) due to a marine heatwave. Frontiers in Marine Science, 6 (84), doi:10.3389/fmars.2019.00084.
Thomsen, M. S. and P. M. South, 2019: Communities and attachment networks associated with primary, secondary and alternative foundation species; a case study of stressed and disturbed stands of southern bull kelp. Diversity, 11 (4), 56, doi:10.3390/d11040056.
Titeux, N. et al., 2016: Biodiversity scenarios neglect future land-use changes. Global Change Biology, 22 (7), 2505–2515, doi:10.1111/gcb.13272.
Tompkins, D. M., A. E. Byrom and R. P. Pech, 2013: Predicted responses of invasive mammal communities to climate-related changes in mast frequency in forest ecosystems. Ecological Applications, 23 (5), 1075–1085, doi:10.1890/12-0915.1.
Trew, B. T. and I. M. D. Maclean, 2021: Vulnerability of global biodiversity hotspots to climate change. Global Ecology and Biogeography, 30 (4), 768–783, doi:10.1111/geb.13272.
Trisos, C. H., C. Merow and A. L. Pigot, 2020: The projected timing of abrupt ecological disruption from climate change. Nature, 580 (7804), 496–501, doi:10.1038/s41586-020-2189-9.
Tulloch, V. J. D. et al., 2019: Future recovery of baleen whales is imperiled by climate change. Global Change Biology, 25 (4), 1263–1281, doi:10.1111/gcb.14573.
Ukkola, A. M. et al., 2016: Reduced streamflow in water-stressed climates consistent with CO2 effects on vegetation. Nature Climate Change, 6, 75–78, doi:10.1038/nclimate2831.
Vale, M. M., T. V. Souza, M. A. S. Alves and R. Crouzeilles, 2018: Planning protected areas network that are relevant today and under future climate change is possible: the case of Atlantic Forest endemic birds. PeerJ, 6, e4689, doi:10.7717/peerj.4689.
Vasconcelos, T. d. S., 2014: Tracking climatically suitable areas for an endemic Cerrado snake under climate change. Natureza & Conservação, 12 (1), 47–52, doi:10.4322/natcon.2014.009.
Vasconcelos, T. S., B. T. M. do Nascimento and V. H. M. Prado, 2018: Expected impacts of climate change threaten the anuran diversity in the Brazilian hotspots. Ecology and Evolution, 8 (16), 7894–7906, doi:10.1002/ece3.4357.
Vasconcelos, T. S. and V. H. M. Prado, 2019: Climate change and opposing spatial conservation priorities for anuran protection in the Brazilian hotspots. Journal for Nature Conservation, 49, 118–124, doi:10.1016/j.jnc.2019.04.003.
Vasilakopoulos, P., D. E. Raitsos, E. Tzanatos and C. D. Maravelias, 2017: Resilience and regime shifts in a marine biodiversity hotspot. Scientific Reports, 7 (1), 13647, doi:10.1038/s41598-017-13852-9.
Velazco, S. J. E., F. Villalobos, F. Galvão and P. De Marco Júnior, 2019: A dark scenario for Cerrado plant species: Effects of future climate, land use and protected areas ineffectiveness. Diversity and Distributions, 25 (4), 660–673, doi:10.1111/ddi.12886.
Vergés, A. et al., 2016: Long-term empirical evidence of ocean warming leading to tropicalization of fish communities, increased herbivory, and loss of kelp. Proceedings of the National Academy of Sciences, 113 (48), 13791–13796, doi:10.1073/pnas.1610725113.
Vergés, A. et al., 2019: Tropicalisation of temperate reefs: Implications for ecosystem functions and management actions. Functional Ecology, 33 (6), 1000–1013, doi:10.1111/1365-2435.13310.
Vogiatzakis, I. N., A. M. Mannion and D. Sarris, 2016: Mediterranean island biodiversity and climate change: the last 10,000 years and the future. Biodiversity and Conservation, 25 (13), 2597–2627, doi:10.1007/s10531-016-1204-9.
Wabnitz, C. C. C. et al., 2018: Climate change impacts on marine biodiversity, fisheries and society in the Arabian Gulf. PLOS ONE, 13 (5), e0194537, doi:10.1371/journal.pone.0194537.
Waldock, C. et al., 2019: The shape of abundance distributions across temperature gradients in reef fishes. Ecology Letters, 22 (4), 685–696, doi:10.1111/ele.13222.
Wang, C.-J., J.-Z. Wan and Z.-X. Zhang, 2017: Expansion potential of invasive tree plants in ecoregions under climate change scenarios: an assessment of 54 species at a global scale. Scandinavian Journal of Forest Research, 32 (8), 663–670, doi:10.1080/02827581.2017.1283049.
Wang, Q. et al., 2016: Temporal evolution of the Yellow Sea ecosystem services (1980–2010). Heliyon, 2 (3), e00084, doi:10.1016/j.heliyon.2016.e00084.
Ward, R. D., D. A. Friess, R. H. Day and R. A. MacKenzie, 2016: Impacts of climate change on mangrove ecosystems: a region by region overview. Ecosystem Health and Sustainability, 2 (4), e01211, doi:10.1002/ehs2.1211.
Warren, D. L., A. N. Wright, S. N. Seifert and H. B. Shaffer, 2014: Incorporating model complexity and spatial sampling bias into ecological niche models of climate change risks faced by 90 California vertebrate species of concern. Diversity and Distributions, 20 (3), 334–343, doi:10.1111/ddi.12160.
Warren, R. et al., 2018a: The projected effect on insects, vertebrates, and plants of limiting global warming to 1.5 degrees C rather than 2 degrees C. Science, 360 (6390), 791-+, doi:10.1126/science.aar3646.
Warren, R. et al., 2018b: The implications of the United Nations Paris Agreement on climate change for globally significant biodiversity areas. Climatic Change, 147 (3–4), 395–409, doi:10.1007/s10584-018-2158-6.
Wernberg, T. et al., 2016: Climate-driven regime shift of a temperate marine ecosystem. Science, 353 (6295), 169–172, doi:10.1126/science.aad8745.
Wernberg, T. et al., 2011: Impacts of climate change in a global hotspot for temperate marine biodiversity and ocean warming. Journal of Experimental Marine Biology and Ecology, 400 (1), 7–16, doi:10.1016/j.jembe.2011.02.021.
Wernberg, T. et al., 2013: An extreme climatic event alters marine ecosystem structure in a global biodiversity hotspot. Nature Climate Change, 3 (1), 78–82, doi:10.1038/nclimate1627.
Węsławski, J. M., K. Dragańska-Deja, J. Legeżyńska and W. Walczowski, 2018: Range extension of a boreal amphipod Gammarus oceanicus in the warming Arctic. Ecology and Evolution, 8 (15), 7624–7632, doi:10.1002/ece3.4281.
Węsławski, J. M. et al., 2011: Climate change effects on Arctic fjord and coastal macrobenthic diversity—observations and predictions. Marine Biodiversity, 41 (1), 71–85, doi:10.1007/s12526-010-0073-9.
Wetzel, F. T., H. Beissmann, D. J. Penn and W. Jetz, 2013: Vulnerability of terrestrial island vertebrates to projected sea-level rise. Global Change Biology, 19 (7), 2058-2070, doi:10.1111/gcb.12185.
Wiens, J. J., 2016: Climate-related local extinctions are already widespread among plant and animal species. PLOS Biology, 14 (12), e2001104, doi:10.1371/journal.pbio.2001104.
Williams, J. W., S. T. Jackson and J. E. Kutzbach, 2007: Projected distributions of novel and disappearing climates by 2100 AD. Proceedings of the National Academy of Sciences, 104 (14), 5738–5742, doi:10.1073/pnas.0606292104.
Williams, K. J. et al., 2011: Forests of East Australia: The 35th Biodiversity Hotspot. In: Biodiversity Hotspots: Distribution and Protection of Conservation Priority Areas[Zachos, F. E. and J. C. Habel (eds.)]. Springer Berlin Heidelberg, Berlin, Heidelberg, pp. 295–310. ISBN 978-3-642-20992-5.
Wilson, K. L., M. A. Skinner and H. K. Lotze, 2019: Projected 21st-century distribution of canopy-forming seaweeds in the Northwest Atlantic with climate change. Diversity and Distributions, 25 (4), 582–602, doi:10.1111/ddi.12897.
WMO, 2021: State of the Climate in Latin America and the Caribbean 2020. World Meteorological Organization (WMO), 32 pp. ISBN 978-92-63-11272-9.
Wolter, K., W. Neser, M. T. Hirschauer and A. Camiña, 2016: Cape Vulture Gyps coprotheres breeding status in southern Africa: monitoring results from 2010–2014. Ostrich, 87 (2), 119–123.
Xiu, P., F. Chai, E. N. Curchitser and F. S. Castruccio, 2018: Future changes in coastal upwelling ecosystems with global warming: The case of the California Current System. Scientific Reports, 8 (1), 2866, doi:10.1038/s41598-018-21247-7.
Yamano, H., K. Sugihara and K. Nomura, 2011: Rapid poleward range expansion of tropical reef corals in response to rising sea surface temperatures. Geophysical Research Letters, 38 (4), doi:10.1029/2010GL046474.
Yasuhara, M. et al., 2020: Past and future decline of tropical pelagic biodiversity. Proceedings of the National Academy of Sciences, 117 (23), 12891–12896, doi:10.1073/pnas.1916923117.
Yeruham, E., G. Rilov, M. Shpigel and A. Abelson, 2015: Collapse of the echinoid Paracentrotus lividus populations in the Eastern Mediterranean—result of climate change?Scientific Reports, 5, 13479, doi:10.1038/srep13479.
Young, A. J., D. Guo, P. G. Desmet and G. F. Midgley, 2016: Biodiversity and climate change: Risks to dwarf succulents in Southern Africa. Journal of Arid Environments, 129, 16–24, doi:10.1016/j.jaridenv.2016.02.005.
Zomer, R. J. et al., 2014: Projected climate change impacts on spatial distribution of bioclimatic zones and ecoregions within the Kailash Sacred Landscape of China, India, Nepal. Climatic Change, 125 (3), 445–460, doi:10.1007/s10584-014-1176-2.
Zunino, S., D. M. Canu, V. Bandelj and C. Solidoro, 2017: Effects of ocean acidification on benthic organisms in the Mediterranean Sea under realistic climatic scenarios: A meta-analysis. Regional Studies in Marine Science, 10, 86–96, doi:10.1016/j.rsma.2016.12.011.
Zylstra, P. J., 2018: Flammability dynamics in the Australian Alps. Austral Ecol. , 43 (5), 578–591, doi:10.1111/aec.12594.
1 In this report, the following summary terms are used to describe the available evidence: limited, medium or robust; and for the degree of agreement: low, medium, or high. A level of confidence is expressed using five qualifiers: very low, low, medium, high, and very high, and typeset in italics, for example, medium confidence. For a given evidence and agreement statement, different confidence levels can be assigned, but increasing levels of evidence and degrees of agreement are correlated with increasing confidence.


