Summary for Policymakers


This Summary for Policymakers should be cited as:
IPCC, 2023: Summary for Policymakers. In: Climate Change 2023: Synthesis Report. Contribution of Working Groups I, II and III to the Sixth Assessment Report of the Intergovernmental Panel on Climate Change [Core Writing Team, H. Lee and J. Romero (eds.)]. IPCC, Geneva, Switzerland, pp. 1-34, doi: 10.59327/IPCC/AR6-9789291691647.001
Introduction 
This Synthesis Report (SYR) of the IPCC Sixth Assessment Report (AR6) summarises the state of knowledge of climate change, its widespread impacts and risks, and climate change mitigation and adaptation. It integrates the main findings of the Sixth Assessment Report (AR6) based on contributions from the three Working Groups 1 , and the three Special Reports 2 . The summary for Policymakers (SPM) is structured in three parts: SPM.A Current Status and Trends, SPM.B Future Climate Change, Risks, and Long-Term Responses, and SPM.C Responses in the Near Term 3 .
This report recognizes the interdependence of climate, ecosystems and biodiversity, and human societies; the value of diverse forms of knowledge; and the close linkages between climate change adaptation, mitigation, ecosystem health, human well-being and sustainable development, and reflects the increasing diversity of actors involved in climate action.
Based on scientific understanding, key findings can be formulated as statements of fact or associated with an assessed level of confidence using the IPCC calibrated language 4 .
A. Current Status and Trends
Observed Warming and its Causes
A.1 Human activities, principally through emissions of greenhouse gases, have unequivocally caused global warming, with global surface temperature reaching 1.1°C above 1850-1900 in 2011-2020. Global greenhouse gas emissions have continued to increase, with unequal historical and ongoing contributions arising from unsustainable energy use, land use and land-use change, lifestyles and patterns of consumption and production across regions, between and within countries, and among individuals (high confidence).ExpandLinks to longer report2.1, Figure 2.1, Figure 2.2
A.1.1 Global surface temperature was 1.09°C [0.95 to 1.20] °C5 higher in 2011-2020 than 1850-19006 , with larger increases over land (1.59 [1.34 to 1.83] °C) than over the ocean (0.88 [0.68 to 1.01] °C). Global surface temperature in the first two decades of the 21st century (2001-2020) was 0.99 [0.84 to 1.10] °C higher than 1850-1900. Global surface temperature has increased faster since 1970 than in any other 50-year period over at least the last 2000 years (high confidence). Links to longer report2.1.1, Figure 2.1
A.1.2 The likely range of total human-caused global surface temperature increase from 1850-1900 to 2010-20197 is 0.8°C to 1.3°C, with a best estimate of 1.07°C. Over this period, it is likely that well-mixed greenhouse gases (GHGs) contributed a warming of 1.0°C to 2.0°C8 , and other human drivers (principally aerosols) contributed a cooling of 0.0°C to 0.8°C, natural drivers changed global surface temperature by –0.1°C to +0.1°C, and internal variability changed it by –0.2°C to +0.2°C. Links to longer report2.1.1, Figure 2.1
A.1.3 Observed increases in well-mixed GHG concentrations since around 1750 are unequivocally caused by GHG emissions from human activities over this period. Historical cumulative net CO2 emissions from 1850 to 2019 were 2400 ± 240 GtCO2 of which more than half (58%) occurred between 1850 and 1989, and about 42% occurred between 1990 and 2019 (high confidence). In 2019, atmospheric CO2 concentrations (410 parts per million) were higher than at any time in at least 2 million years (high confidence), and concentrations of methane (1866 parts per billion) and nitrous oxide (332 parts per billion) were higher than at any time in at least 800,000 years (very high confidence). Links to longer report2.1.1, Figure 2.1
A.1.4 Global net anthropogenic GHG emissions have been estimated to be 59 ± 6.6 GtCO2-eq 9 in 2019, about 12% (6.5 GtCO2-eq) higher than in 2010 and 54% (21 GtCO2-eq) higher than in 1990, with the largest share and growth in gross GHG emissions occurring in CO2 from fossil fuels combustion and industrial processes (CO2-FFI) followed by methane, whereas the highest relative growth occurred in fluorinated gases (F-gases), starting from low levels in 1990. Average annual GHG emissions during 2010-2019 were higher than in any previous decade on record, while the rate of growth between 2010 and 2019 (1.3% year -1) was lower than that between 2000 and 2009 (2.1% year -1). In 2019, approximately 79% of global GHG emissions came from the sectors of energy, industry, transport, and buildings together and 22%10 from agriculture, forestry and other land use (AFOLU). Emissions reductions in CO2-FFI due to improvements in energy intensity of GDP and carbon intensity of energy, have been less than emissions increases from rising global activity levels in industry, energy supply, transport, agriculture and buildings. (high confidence) Links to longer report2.1.1
A.1.5 Historical contributions of CO2 emissions vary substantially across regions in terms of total magnitude, but also in terms of contributions to CO2-FFI and net CO2 emissions from land use, land-use change and forestry (CO2-LULUCF). In 2019, around 35% of the global population live in countries emitting more than 9 tCO2-eq per capita 11 (excluding CO2-LULUCF) while 41% live in countries emitting less than 3 tCO2-eq per capita; of the latter a substantial share lacks access to modern energy services. Least Developed Countries (LDCs) and Small Island Developing States (SIDS) have much lower per capita emissions (1.7 tCO2-eq and 4.6 tCO2-eq, respectively) than the global average (6.9 tCO2-eq), excluding CO2-LULUCF. The 10% of households with the highest per capita emissions contribute 34–45% of global consumption-based household GHG emissions, while the bottom 50% contribute 13–15%. (high confidence) Links to longer report2.1.1, Figure 2.2
Observed Changes and Impacts
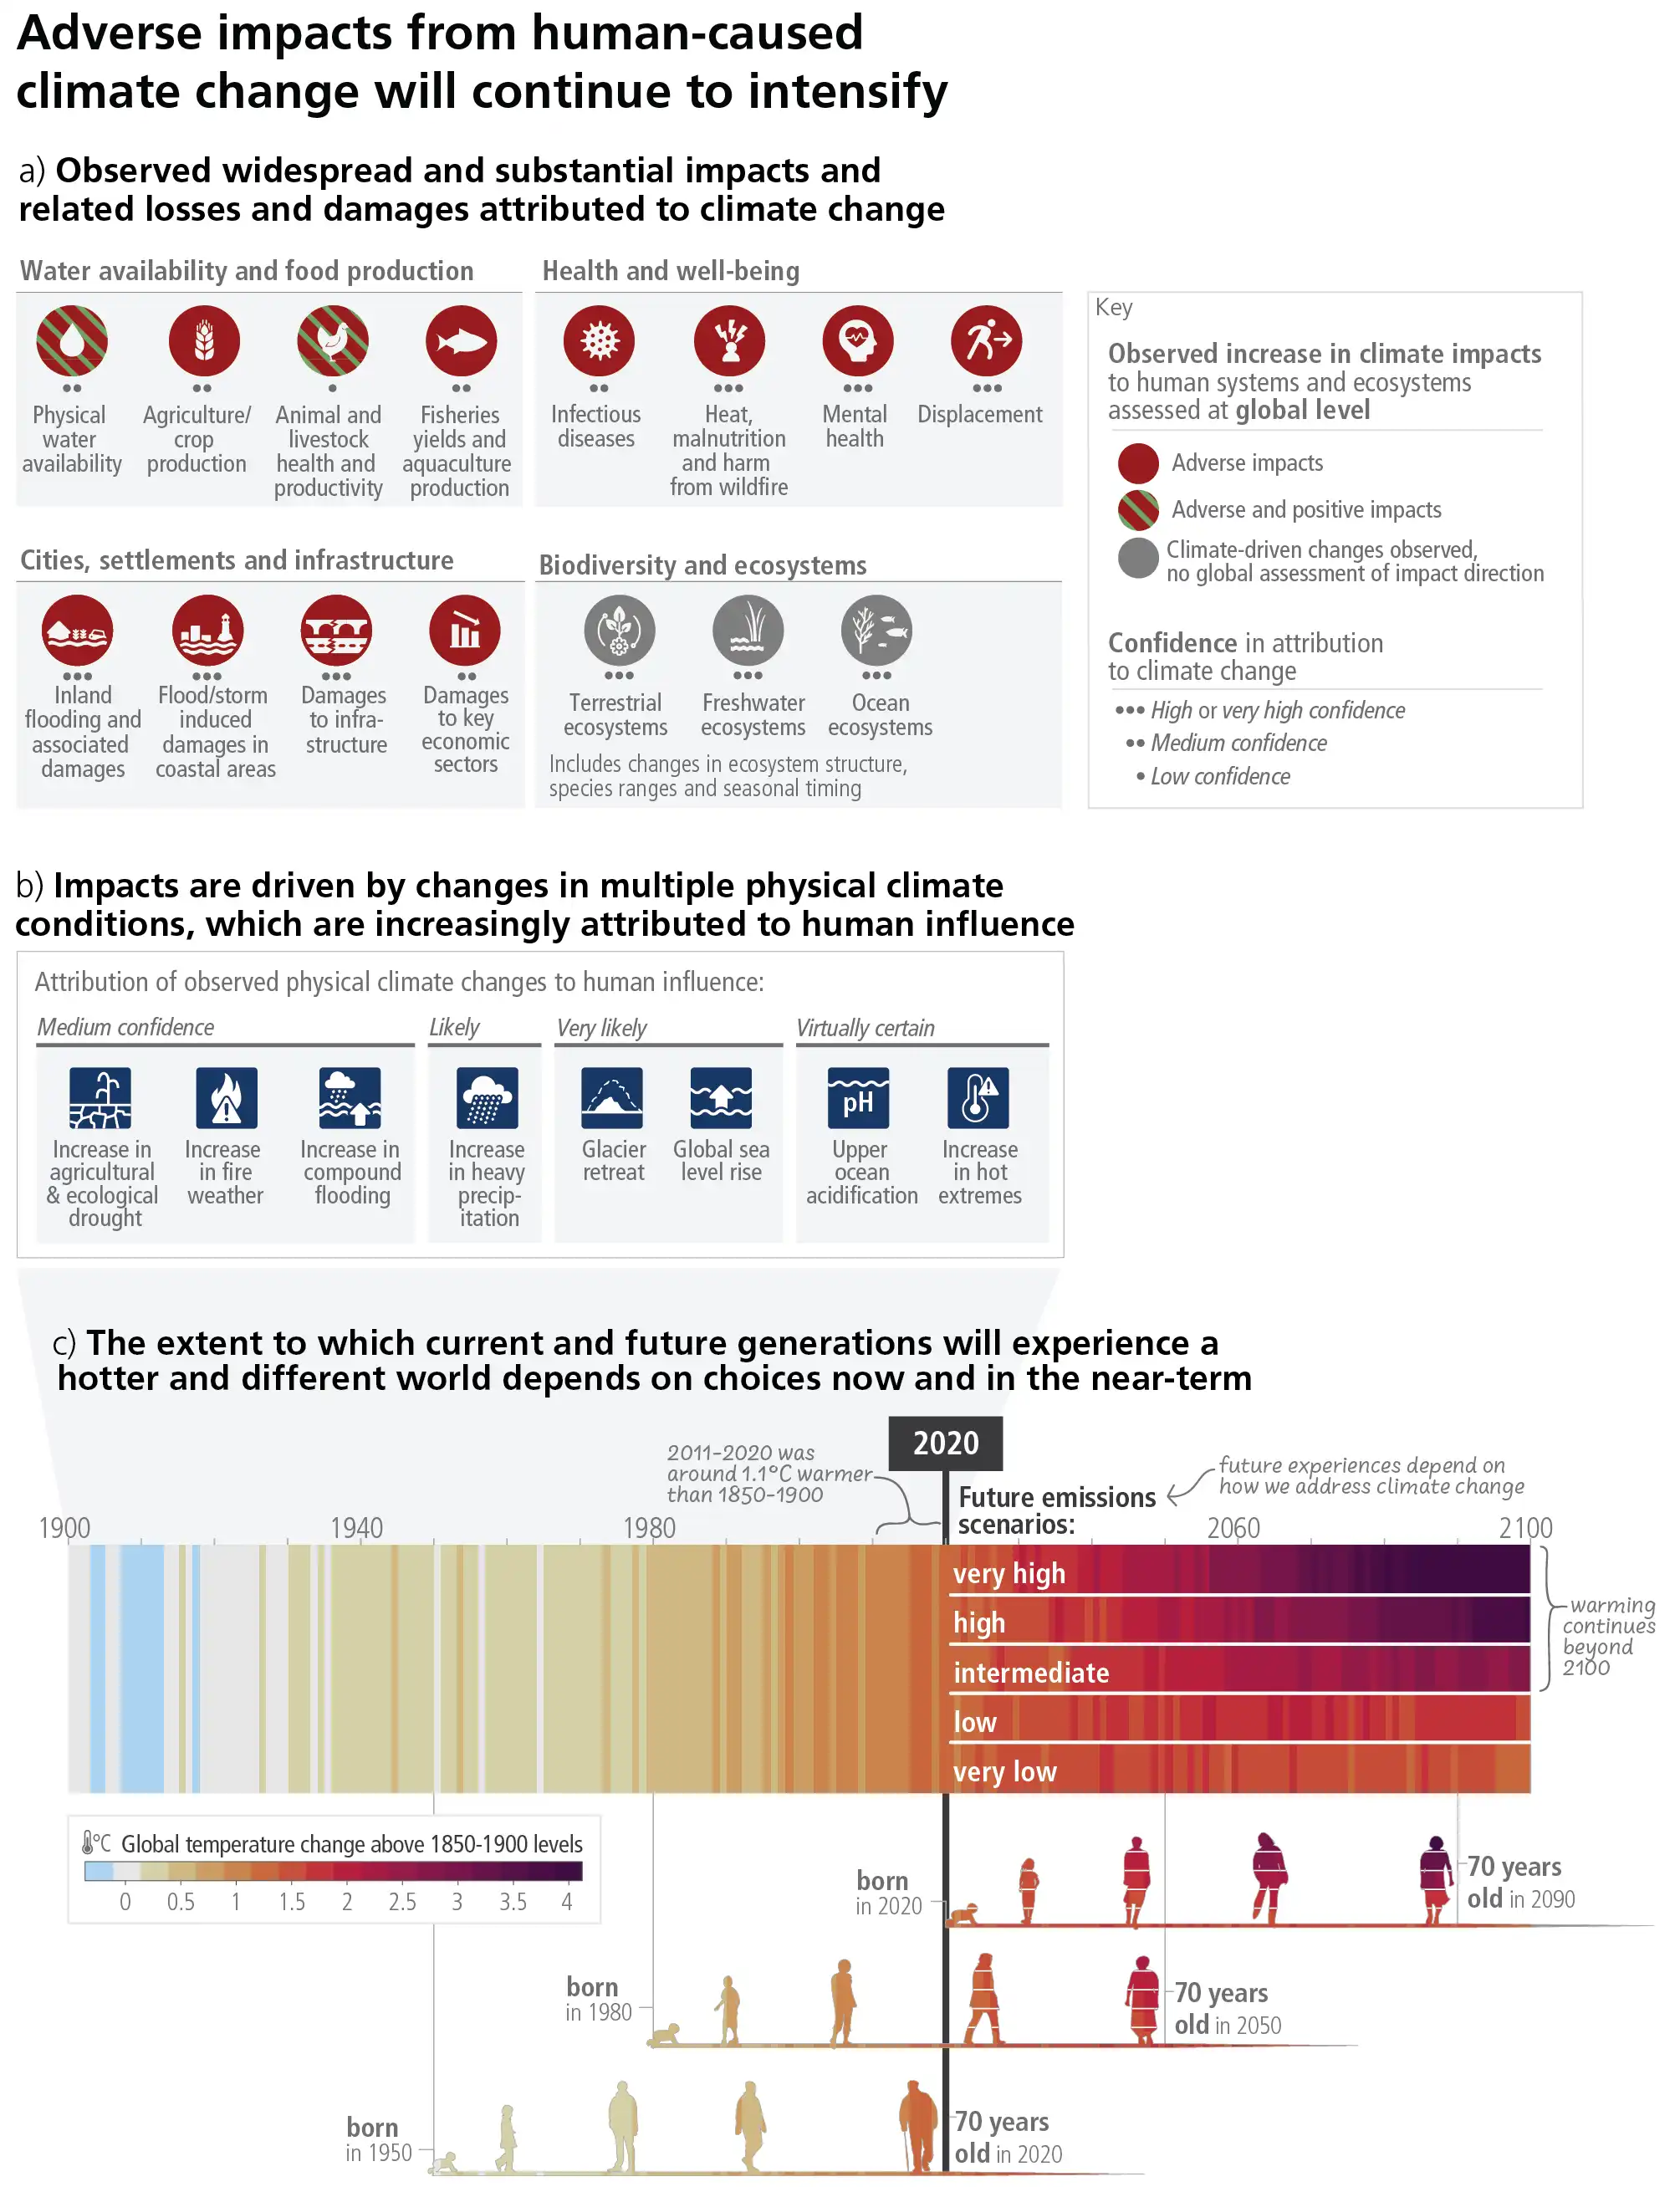
A.2 Widespread and rapid changes in the atmosphere, ocean, cryosphere and biosphere have occurred. Human-caused climate change is already affecting many weather and climate extremes in every region across the globe. This has led to widespread adverse impacts and related losses and damages to nature and people (high confidence). Vulnerable communities who have historically contributed the least to current climate change are disproportionately affected (high confidence).Expand Figure SPM.1 Links to longer report2.1, Table 2.1, Figures 2.2 and 2.3
A.2.1 It is unequivocal that human influence has warmed the atmosphere, ocean and land. Global mean sea level increased by 0.20 [0.15 to 0.25] m between 1901 and 2018. The average rate of sea level rise was 1.3 [0.6 to 2.1] mm yr -1 between 1901 and 1971, increasing to 1.9 [0.8 to 2.9] mm yr -1 between 1971 and 2006, and further increasing to 3.7 [3.2 to 4.2] mm yr -1 between 2006 and 2018 (high confidence). Human influence was very likely the main driver of these increases since at least 1971. Evidence of observed changes in extremes such as heatwaves, heavy precipitation, droughts, and tropical cyclones, and, in particular, their attribution to human influence, has further strengthened since AR5. Human influence has likely increased the chance of compound extreme events since the 1950s, including increases in the frequency of concurrent heatwaves and droughts (high confidence). Figure SPM.1 Links to longer report2.1.2, Table 2.1, Figure 2.3, Figure 3.4
A.2.2 Approximately 3.3 to 3.6 billion people live in contexts that are highly vulnerable to climate change. Human and ecosystem vulnerability are interdependent. Regions and people with considerable development constraints have high vulnerability to climatic hazards. Increasing weather and climate extreme events have exposed millions of people to acute food insecurity 12 and reduced water security, with the largest adverse impacts observed in many locations and/or communities in Africa, Asia, Central and South America, LDCs, Small Islands and the Arctic, and globally for Indigenous Peoples, small-scale food producers and low-income households. Between 2010 and 2020, human mortality from floods, droughts and storms was 15 times higher in highly vulnerable regions, compared to regions with very low vulnerability. (high confidence) Figure SPM.1 Links to longer report2.1.2, 4.4
A.2.3 Climate change has caused substantial damages, and increasingly irreversible losses, in terrestrial, freshwater, cryospheric, and coastal and open ocean ecosystems (high confidence). Hundreds of local losses of species have been driven by increases in the magnitude of heat extremes (high confidence) with mass mortality events recorded on land and in the ocean (very high confidence). Impacts on some ecosystems are approaching irreversibility such as the impacts of hydrological changes resulting from the retreat of glaciers, or the changes in some mountain (medium confidence) and Arctic ecosystems driven by permafrost thaw (high confidence). Figure SPM.1 Links to longer report2.1.2, Figure 2.3
A.2.4 Climate change has reduced food security and affected water security, hindering efforts to meet Sustainable Development Goals (high confidence). Although overall agricultural productivity has increased, climate change has slowed this growth over the past 50 years globally (medium confidence), with related negative impacts mainly in mid- and low latitude regions but positive impacts in some high latitude regions (high confidence). Ocean warming and ocean acidification have adversely affected food production from fisheries and shellfish aquaculture in some oceanic regions (high confidence). Roughly half of the world’s population currently experience severe water scarcity for at least part of the year due to a combination of climatic and non-climatic drivers (medium confidence). Figure SPM.1 Links to longer report2.1.2, Figure 2.3
A.2.5 In all regions increases in extreme heat events have resulted in human mortality and morbidity (very high confidence). The occurrence of climate-related food-borne and water-borne diseases (very high confidence) and the incidence of vector-borne diseases (high confidence) have increased. In assessed regions, some mental health challenges are associated with increasing temperatures (high confidence), trauma from extreme events (very high confidence), and loss of livelihoods and culture (high confidence). Climate and weather extremes are increasingly driving displacement in Africa, Asia, North America (high confidence), and Central and South America (medium confidence), with small island states in the Caribbean and South Pacific being disproportionately affected relative to their small population size (high confidence). Figure SPM.1 Links to longer report2.1.2, Figure 2.3
A.2.6 Climate change has caused widespread adverse impacts and related losses and damages 13 to nature and people that are unequally distributed across systems, regions and sectors. Economic damages from climate change have been detected in climate-exposed sectors, such as agriculture, forestry, fishery, energy, and tourism. Individual livelihoods have been affected through, for example, destruction of homes and infrastructure, and loss of property and income, human health and food security, with adverse effects on gender and social equity. (high confidence) Figure SPM.1 Links to longer report2.1.2
A.2.7 In urban areas, observed climate change has caused adverse impacts on human health, livelihoods and key infrastructure. Hot extremes have intensified in cities. Urban infrastructure, including transportation, water, sanitation and energy systems have been compromised by extreme and slow-onset events 14 , with resulting economic losses, disruptions of services and negative impacts to well-being. Observed adverse impacts are concentrated amongst economically and socially marginalised urban residents. (high confidence) Links to longer report2.1.2
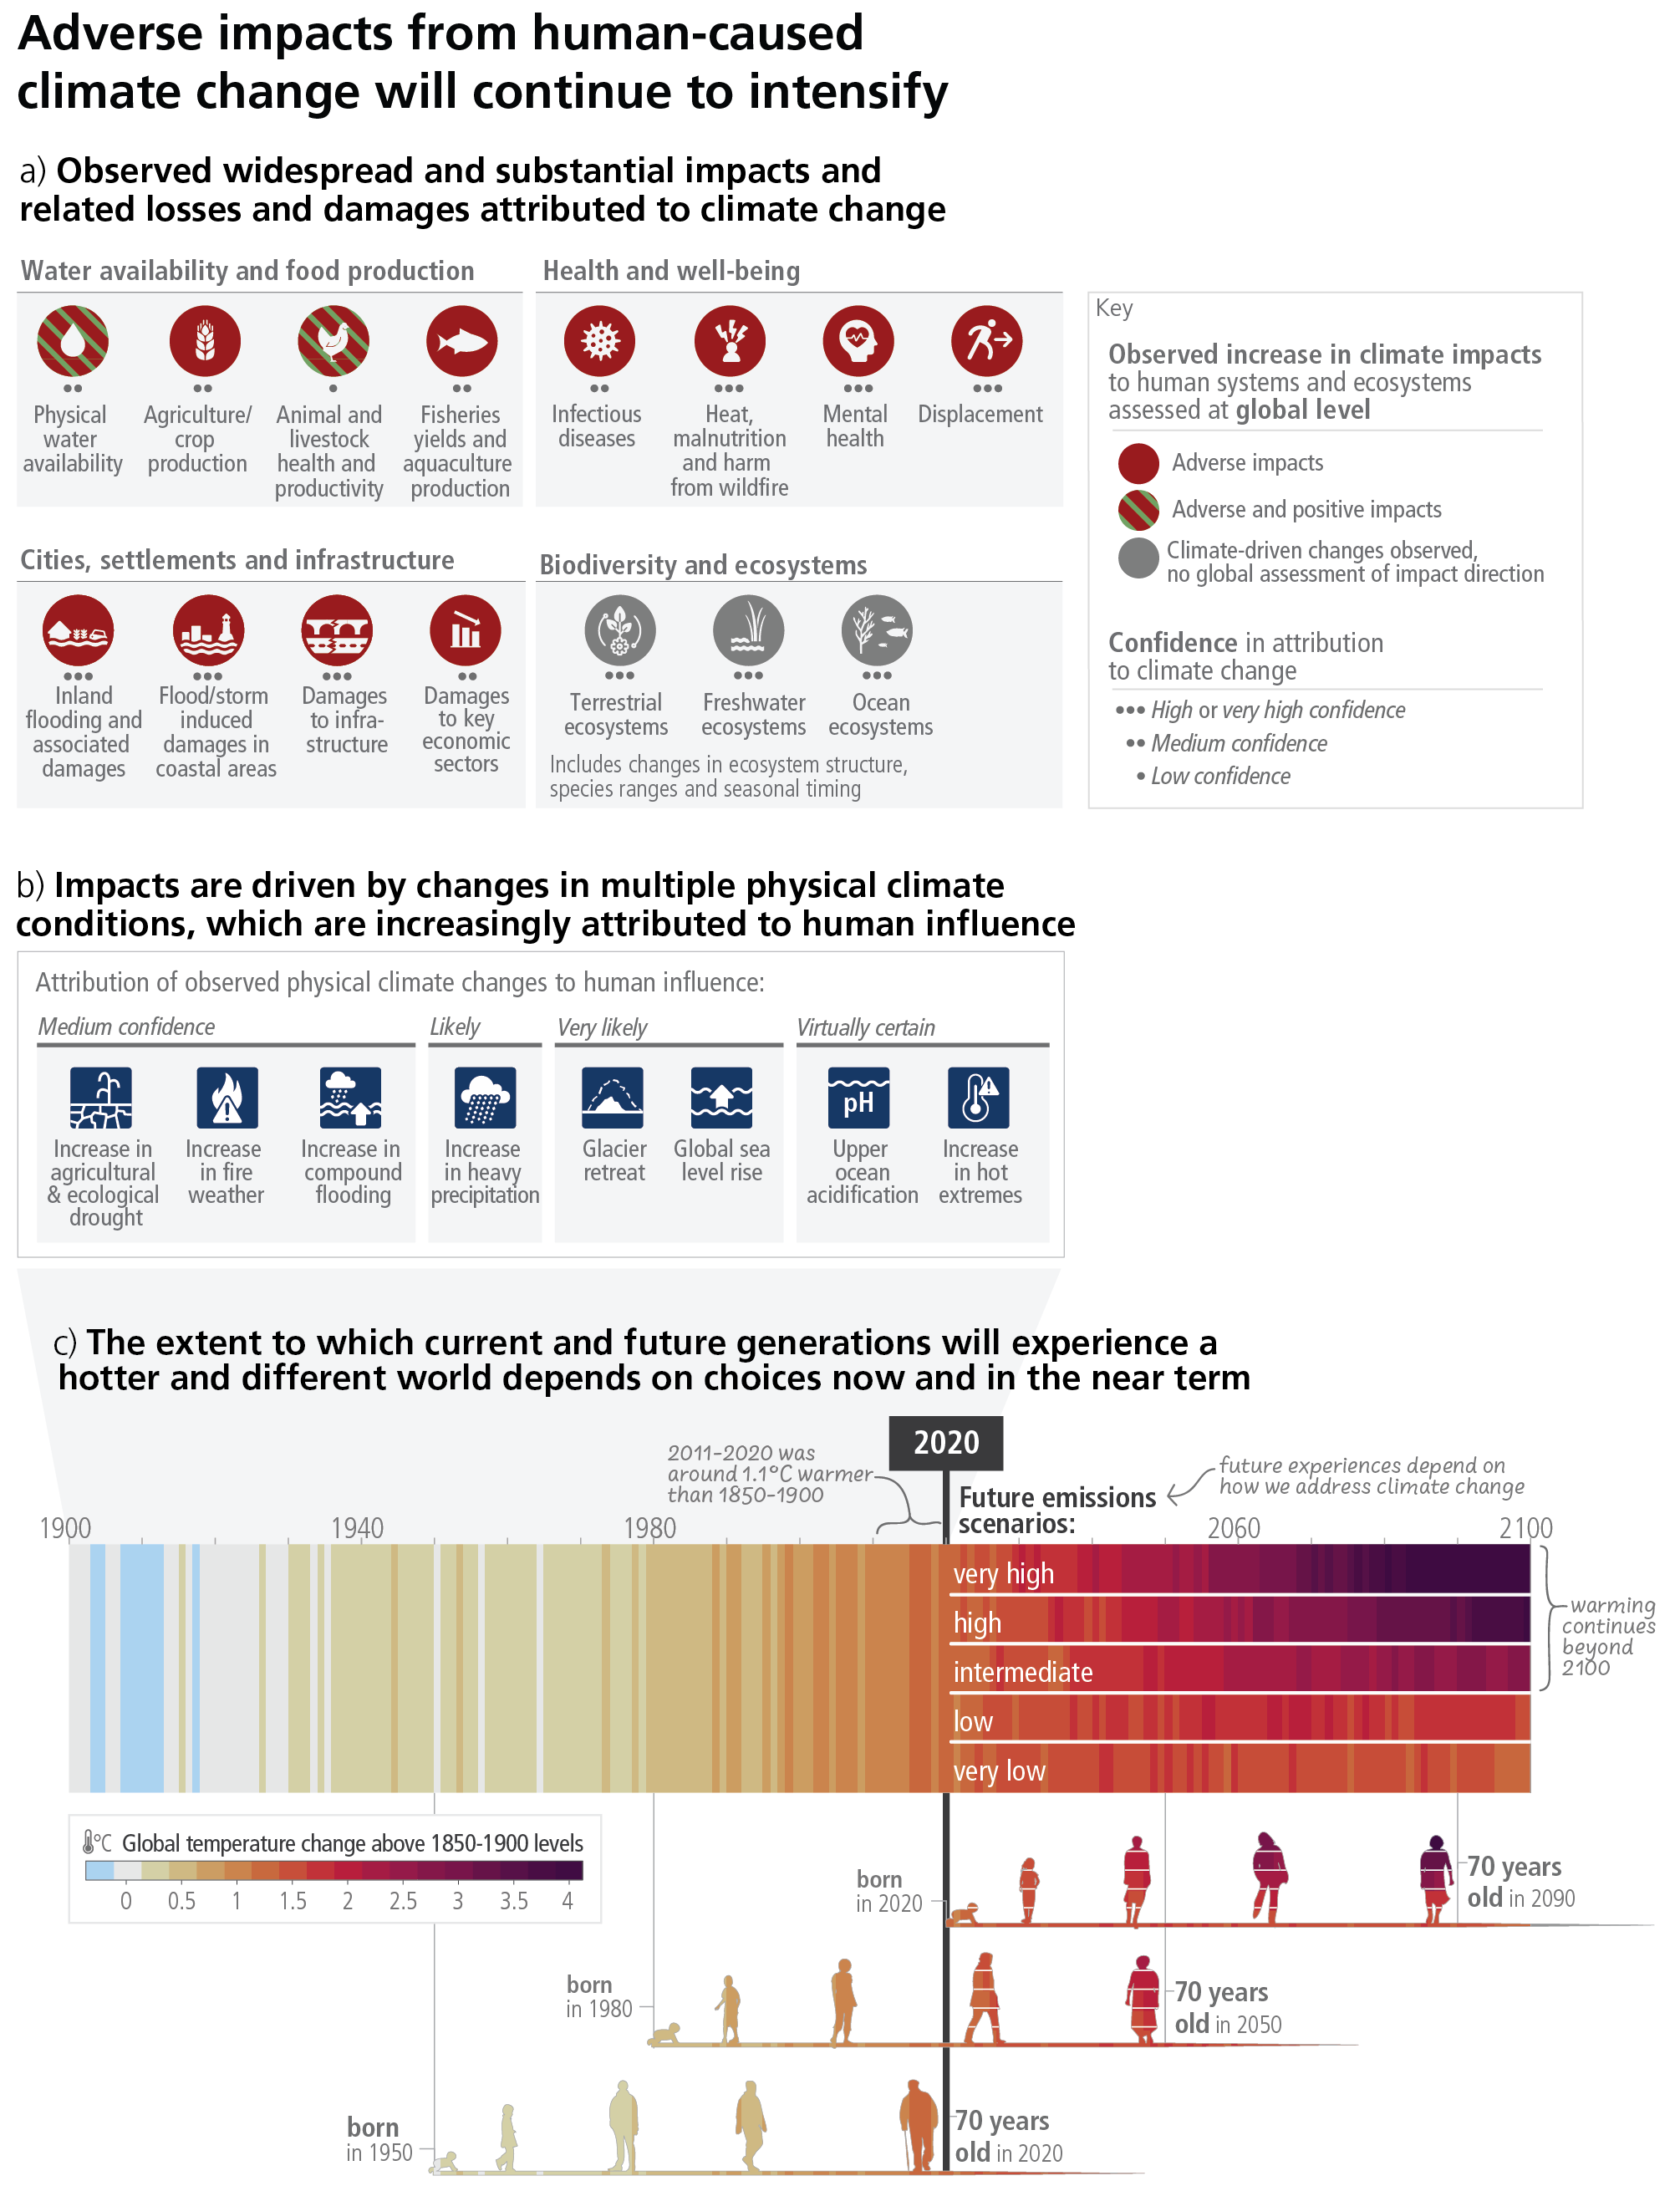
Figure SPM.1: (a) Climate change has already caused widespread impacts and related losses and damages on human systems and altered terrestrial, freshwater and ocean ecosystems worldwide. Physical water availability includes balance of water available from various sources including ground water, water quality and demand for water. Global mental health and displacement assessments reflect only assessed regions. Confidence levels reflect the assessment of attribution of the observed impact to climate change. (b) Observed impacts are connected to physical climate changes including many that have been attributed to human influence such as the selected climatic impact-drivers shown. Confidence and likelihood levels reflect the assessment of attribution of the observed climatic impact-driver to human influence. (c) Observed (1900-2020) and projected (2021-2100) changes in global surface temperature (relative to 1850-1900), which are linked to changes in climate conditions and impacts, illustrate how the climate has already changed and will change along the lifespan of three representative generations (born in 1950, 1980 and 2020). Future projections (2021-2100) of changes in global surface temperature are shown for very low (SSP1-1.9), low (SSP1-2.6), intermediate (SSP2-4.5), high (SSP3-7.0) and very high (SSP5-8.5) GHG emissions scenarios. Changes in annual global surface temperatures are presented as ‘climate stripes’, with future projections showing the human-caused long-term trends and continuing modulation by natural variability (represented here using observed levels of past natural variability). Colours on the generational icons correspond to the global surface temperature stripes for each year, with segments on future icons differentiating possible future experiences.  Box SPM.1 Links to longer report2.1, 2.1.2, Figure 2.1, Table 2.1, Figure 2.3, Cross-Section Box.2, 3.1, Figure 3.3, 4.1, 4.3
Current Progress in Adaptation and Gaps and Challenges
A.3 Adaptation planning and implementation has progressed across all sectors and regions, with documented benefits and varying effectiveness. Despite progress, adaptation gaps exist, and will continue to grow at current rates of implementation. Hard and soft limits to adaptation have been reached in some ecosystems and regions. Maladaptation is happening in some sectors and regions. Current global financial flows for adaptation are insufficient for, and constrain implementation of, adaptation options, especially in developing countries (high confidence).ExpandLinks to longer report2.2, 2.3
A.3.1 Progress in adaptation planning and implementation has been observed across all sectors and regions, generating multiple benefits (very high confidence). Growing public and political awareness of climate impacts and risks has resulted in at least 170 countries and many cities including adaptation in their climate policies and planning processes (high confidence). Links to longer report2.2.3
A.3.2 Effectiveness 15 of adaptation in reducing climate risks 16 is documented for specific contexts, sectors and regions (high confidence). Examples of effective adaptation options include: cultivar improvements, on-farm water management and storage, soil moisture conservation, irrigation, agroforestry, community-based adaptation, farm and landscape level diversification in agriculture, sustainable land management approaches, use of agroecological principles and practices and other approaches that work with natural processes (high confidence). Ecosystem-based adaptation 17 approaches such as urban greening, restoration of wetlands and upstream forest ecosystems have been effective in reducing flood risks and urban heat (high confidence). Combinations of non-structural measures like early warning systems and structural measures like levees have reduced loss of lives in case of inland flooding (medium confidence). Adaptation options such as disaster risk management, early warning systems, climate services and social safety nets have broad applicability across multiple sectors (high confidence). Links to longer report2.2.3
A.3.3 Most observed adaptation responses are fragmented, incremental 18 , sector-specific and unequally distributed across regions. Despite progress, adaptation gaps exist across sectors and regions, and will continue to grow under current levels of implementation, with the largest adaptation gaps among lower income groups. (high confidence). Links to longer report2.3.2
A.3.4 There is increased evidence of maladaptation in various sectors and regions (high confidence). Maladaptation especially affects marginalised and vulnerable groups adversely (high confidence). Links to longer report2.3.2
A.3.5 Soft limits to adaptation are currently being experienced by small-scale farmers and households along some low-lying coastal areas (medium confidence) resulting from financial, governance, institutional and policy constraints (high confidence). Some tropical, coastal, polar and mountain ecosystems have reached hard adaptation limits (high confidence). Adaptation does not prevent all losses and damages, even with effective adaptation and before reaching soft and hard limits (high confidence). Links to longer report2.3.2
A.3.6 Key barriers to adaptation are limited resources, lack of private sector and citizen engagement, insufficient mobilization of finance (including for research), low climate literacy, lack of political commitment, limited research and/or slow and low uptake of adaptation science, and low sense of urgency. There are widening disparities between the estimated costs of adaptation and the finance allocated to adaptation (high confidence). Adaptation finance has come predominantly from public sources, and a small proportion of global tracked climate finance was targeted to adaptation and an overwhelming majority to mitigation (very high confidence). Although global tracked climate finance has shown an upward trend since AR5, current global financial flows for adaptation, including from public and private finance sources, are insufficient and constrain implementation of adaptation options, especially in developing countries (high confidence). Adverse climate impacts can reduce the availability of financial resources by incurring losses and damages and through impeding national economic growth, thereby further increasing financial constraints for adaptation, particularly for developing and least developed countries (medium confidence). Links to longer report2.3.2, 2.3.3
Box SPM.1 The use of scenarios and modelled pathways in the AR6 Synthesis Report
Modelled scenarios and pathways 19 are used to explore future emissions, climate change, related impacts and risks, and possible mitigation and adaptation strategies and are based on a range of assumptions, including socio-economic variables and mitigation options. These are quantitative projections and are neither predictions nor forecasts. Global modelled emission pathways, including those based on cost effective approaches contain regionally differentiated assumptions and outcomes, and have to be assessed with the careful recognition of these assumptions. Most do not make explicit assumptions about global equity, environmental justice or intra-regional income distribution. IPCC is neutral with regard to the assumptions underlying the scenarios in the literature assessed in this report, which do not cover all possible futures. 20 Links to longer reportCross-Section Box.2
WGI assessed the climate response to five illustrative scenarios based on Shared Socio-economic Pathways (SSPs)21 that cover the range of possible future development of anthropogenic drivers of climate change found in the literature. High and very high GHG emissions scenarios (SSP3-7.0 and SSP5-8.522 ) have CO2 emissions that roughly double from current levels by 2100 and 2050, respectively. The intermediate GHG emissions scenario (SSP2-4.5) has CO2 emissions remaining around current levels until the middle of the century. The very low and low GHG emissions scenarios (SSP1-1.9 and SSP1-2.6) have CO2 emissions declining to net zero around 2050 and 2070, respectively, followed by varying levels of net negative CO2 emissions. In addition, Representative Concentration Pathways (RCPs)23 were used by WGI and WGII to assess regional climate changes, impacts and risks. In WGIII, a large number of global modelled emissions pathways were assessed, of which 1202 pathways were categorised based on their assessed global warming over the 21st century; categories range from pathways that limit warming to 1.5°C with more than 50% likelihood (noted >50% in this report) with no or limited overshoot (C1) to pathways that exceed 4°C (C8). Links to longer reportCross-Section Box.2 (Box SPM.1, Table 1)
Global warming levels (GWLs) relative to 1850-1900 are used to integrate the assessment of climate change and related impacts and risks since patterns of changes for many variables at a given GWL are common to all scenarios considered and independent of timing when that level is reached. Links to longer reportCross-Section Box.2
Box SPM.1, Table 1: Description and relationship of scenarios and modelled pathways considered across AR6 Working Group reports. Links to longer reportCross-Section Box.2, Figure 1
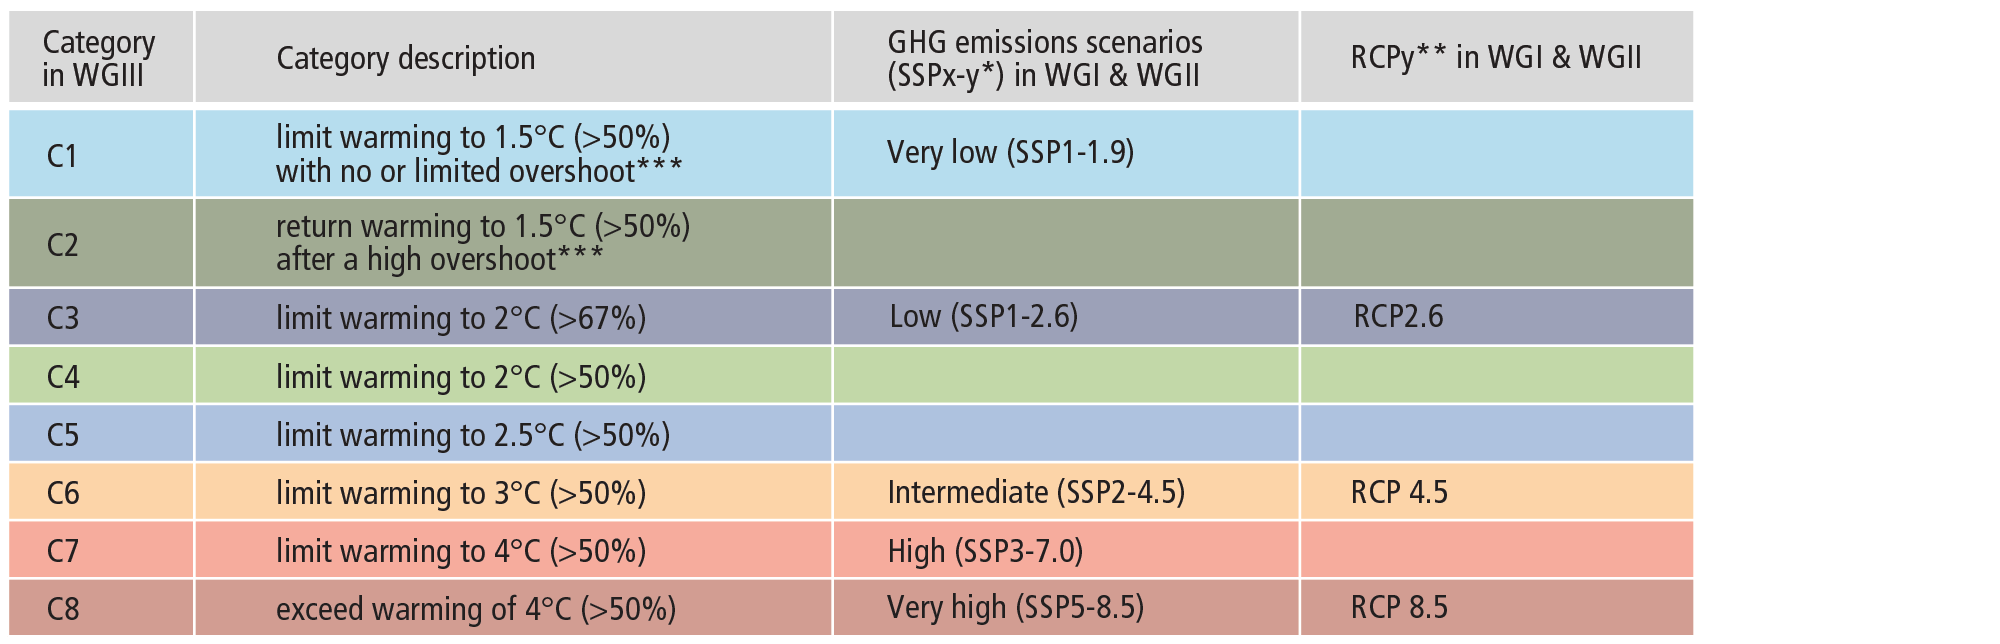
* See footnote 27 for the SSPx-y terminology.
** See footnote 28 for the RCPy terminology.
*** Limited overshoot refers to exceeding 1.5°C global warming by up to about 0.1°C, high overshoot by 0.1°C-0.3°C, in both cases for up to several decades.
Current Mitigation Progress, Gaps and Challenges
A.4 Policies and laws addressing mitigation have consistently expanded since AR5. Global GHG emissions in 2030 implied by nationally determined contributions (NDCs) announced by October 2021 make it likely that warming will exceed 1.5°C during the 21st century and make it harder to limit warming below 2°C. There are gaps between projected emissions from implemented policies and those from NDCs and finance flows fall short of the levels needed to meet climate goals across all sectors and regions. (high confidence)ExpandLinks to longer report2.2, 2.3, Figure 2.5, Table 2.2
A.4.1 The UNFCCC, Kyoto Protocol, and the Paris Agreement are supporting rising levels of national ambition. The Paris Agreement, adopted under the UNFCCC, with near universal participation, has led to policy development and target-setting at national and sub-national levels, in particular in relation to mitigation, as well as enhanced transparency of climate action and support (medium confidence). Many regulatory and economic instruments have already been deployed successfully (high confidence). In many countries, policies have enhanced energy efficiency, reduced rates of deforestation and accelerated technology deployment, leading to avoided and in some cases reduced or removed emissions (high confidence). Multiple lines of evidence suggest that mitigation policies have led to several Gt CO2-eq yr -124 of avoided global emissions (medium confidence). At least 18 countries have sustained absolute production-based GHG and consumption-based CO2 reductions 25 for longer than 10 years. These reductions have only partly offset global emissions growth (high confidence) . Links to longer report2.2.1, 2.2.2
A.4.2 Several mitigation options, notably solar energy, wind energy, electrification of urban systems, urban green infrastructure, energy efficiency, demand-side management, improved forest- and crop/grassland management, and reduced food waste and loss, are technically viable, are becoming increasingly cost effective and are generally supported by the public. From 2010-2019 there have been sustained decreases in the unit costs of solar energy (85%), wind energy (55%), and lithium-ion batteries (85%), and large increases in their deployment, e.g., >10x for solar and >100x for electric vehicles (EVs), varying widely across regions. The mix of policy instruments that reduced costs and stimulated adoption includes public R&D, funding for demonstration and pilot projects, and demand-pull instruments such as deployment subsidies to attain scale. Maintaining emission-intensive systems may, in some regions and sectors, be more expensive than transitioning to low emission systems. (high confidence) Links to longer report2.2.2, Figure 2.4
A.4.3 A substantial ‘emissions gap’ exists between global GHG emissions in 2030 associated with the implementation of NDCs announced prior to COP2626 and those associated with modelled mitigation pathways that limit warming to 1.5°C (>50%) with no or limited overshoot or limit warming to 2°C (>67%) assuming immediate action (high confidence). This would make it likely that warming will exceed 1.5°C during the 21st century (high confidence). Global modelled mitigation pathways that limit warming to 1.5°C (>50%) with no or limited overshoot or limit warming to 2°C (>67%) assuming immediate action imply deep global GHG emissions reductions this decade (high confidence) (see SPM Box 1, Table 1, B.6)27 . Modelled pathways that are consistent with NDCs announced prior to COP26 until 2030 and assume no increase in ambition thereafter have higher emissions, leading to a median global warming of 2.8 [2.1 to 3.4] °C by 2100 (medium confidence). Many countries have signalled an intention to achieve net zero GHG or net zero CO2 by around mid-century but pledges differ across countries in terms of scope and specificity, and limited policies are to date in place to deliver on them. Links to longer report2.3.1, Table 2.2, Figure 2.5, Table 3.1, 4.1
A.4.4 Policy coverage is uneven across sectors (high confidence). Policies implemented by the end of 2020 are projected to result in higher global GHG emissions in 2030 than emissions implied by NDCs, indicating an ‘implementation gap’ (high confidence). Without a strengthening of policies, global warming of 3.2 [2.2 to 3.5] °C is projected by 2100 (medium confidence). Box SPM.1 Figure SPM.5 Links to longer report2.2.2, 2.3.1, 3.1.1, Figure 2.5
A.4.5 The adoption of low-emission technologies lags in most developing countries, particularly least developed ones, due in part to limited finance, technology development and transfer, and capacity (medium confidence). The magnitude of climate finance flows has increased over the last decade and financing channels have broadened but growth has slowed since 2018 (high confidence). Financial flows have developed heterogeneously across regions and sectors (high confidence). Public and private finance flows for fossil fuels are still greater than those for climate adaptation and mitigation (high confidence). The overwhelming majority of tracked climate finance is directed towards mitigation, but nevertheless falls short of the levels needed to limit warming to below 2°C or to 1.5°C across all sectors and regions (see C7.2) (very high confidence). In 2018, public and publicly mobilised private climate finance flows from developed to developing countries were below the collective goal under the UNFCCC and Paris Agreement to mobilise USD 100 billion per year by 2020 in the context of meaningful mitigation action and transparency on implementation (medium confidence). Links to longer report2.2.2, 2.3.1, 2.3.3
B. Future Climate Change, Risks, and Long-Term Responses
Future Climate Change
B.1 Continued greenhouse gas emissions will lead to increasing global warming, with the best estimate of reaching 1.5°C in the near term in considered scenarios and modelled pathways. Every increment of global warming will intensify multiple and concurrent hazards (high confidence). Deep, rapid, and sustained reductions in greenhouse gas emissions would lead to a discernible slowdown in global warming within around two decades, and also to discernible changes in atmospheric composition within a few years (high confidence). Expand Figure SPM.2 Box SPM.1Links to longer reportCross-Section Boxes 1 and 2, 3.1, 3.3, Table 3.1, Figure 3.1, 4.3
B.1.1 Global warming 28 will continue to increase in the near term (2021-2040) mainly due to increased cumulative CO2 emissions in nearly all considered scenarios and modelled pathways. In the near term, global warming is more likely than not to reach 1.5°C even under the very low GHG emission scenario (SSP1-1.9) and likely or very likely to exceed 1.5°C under higher emissions scenarios. In the considered scenarios and modelled pathways, the best estimates of the time when the level of global warming of 1.5°C is reached lie in the near term 29 . Global warming declines back to below 1.5°C by the end of the 21st century in some scenarios and modelled pathways (see B.7). The assessed climate response to GHG emissions scenarios results in a best estimate of warming for 2081-2100 that spans a range from 1.4°C for a very low GHG emissions scenario (SSP1-1.9) to 2.7°C for an intermediate GHG emissions scenario (SSP2-4.5) and 4.4°C for a very high GHG emissions scenario (SSP5-8.5)30 , with narrower uncertainty ranges 31 than for corresponding scenarios in AR5. Box SPM.1 Links to longer reportCross-Section Boxes 1 and 2, 3.1.1, 3.3.4, Table 3.1, 4.3
B.1.2 Discernible differences in trends of global surface temperature between contrasting GHG emissions scenarios (SSP1-1.9 and SSP1-2.6 vs. SSP3-7.0 and SSP5-8.5) would begin to emerge from natural variability 32 within around 20 years. Under these contrasting scenarios, discernible effects would emerge within years for GHG concentrations, and sooner for air quality improvements, due to the combined targeted air pollution controls and strong and sustained methane emissions reductions. Targeted reductions of air pollutant emissions lead to more rapid improvements in air quality within years compared to reductions in GHG emissions only, but in the long term, further improvements are projected in scenarios that combine efforts to reduce air pollutants as well as GHG emissions 33 . (high confidence) Links to longer report3.1.1
B.1.3 Continued emissions will further affect all major climate system components. With every additional increment of global warming, changes in extremes continue to become larger. Continued global warming is projected to further intensify the global water cycle, including its variability, global monsoon precipitation, and very wet and very dry weather and climate events and seasons (high confidence). In scenarios with increasing CO2 emissions, natural land and ocean carbon sinks are projected to take up a decreasing proportion of these emissions (high confidence). Other projected changes include further reduced extents and/or volumes of almost all cryospheric elements 34 (high confidence), further global mean sea level rise (virtually certain), and increased ocean acidification (virtually certain) and deoxygenation (high confidence). Figure SPM.2 Links to longer report3.1.1, 3.3.1, Figure 3.4
B.1.4 With further warming, every region is projected to increasingly experience concurrent and multiple changes in climatic impact-drivers. Compound heatwaves and droughts are projected to become more frequent, including concurrent events across multiple locations (high confidence). Due to relative sea level rise, current 1-in-100 year extreme sea level events are projected to occur at least annually in more than half of all tide gauge locations by 2100 under all considered scenarios (high confidence). Other projected regional changes include intensification of tropical cyclones and/or extratropical storms (medium confidence), and increases in aridity and fire weather (medium to high confidence). Links to longer report3.1.1, 3.1.3
B.1.5 Natural variability will continue to modulate human-caused climate changes, either attenuating or amplifying projected changes, with little effect on centennial-scale global warming (high confidence). These modulations are important to consider in adaptation planning, especially at the regional scale and in the near term. If a large explosive volcanic eruption were to occur 35 , it would temporarily and partially mask human-caused climate change by reducing global surface temperature and precipitation for one to three years (medium confidence). Links to longer report4.3
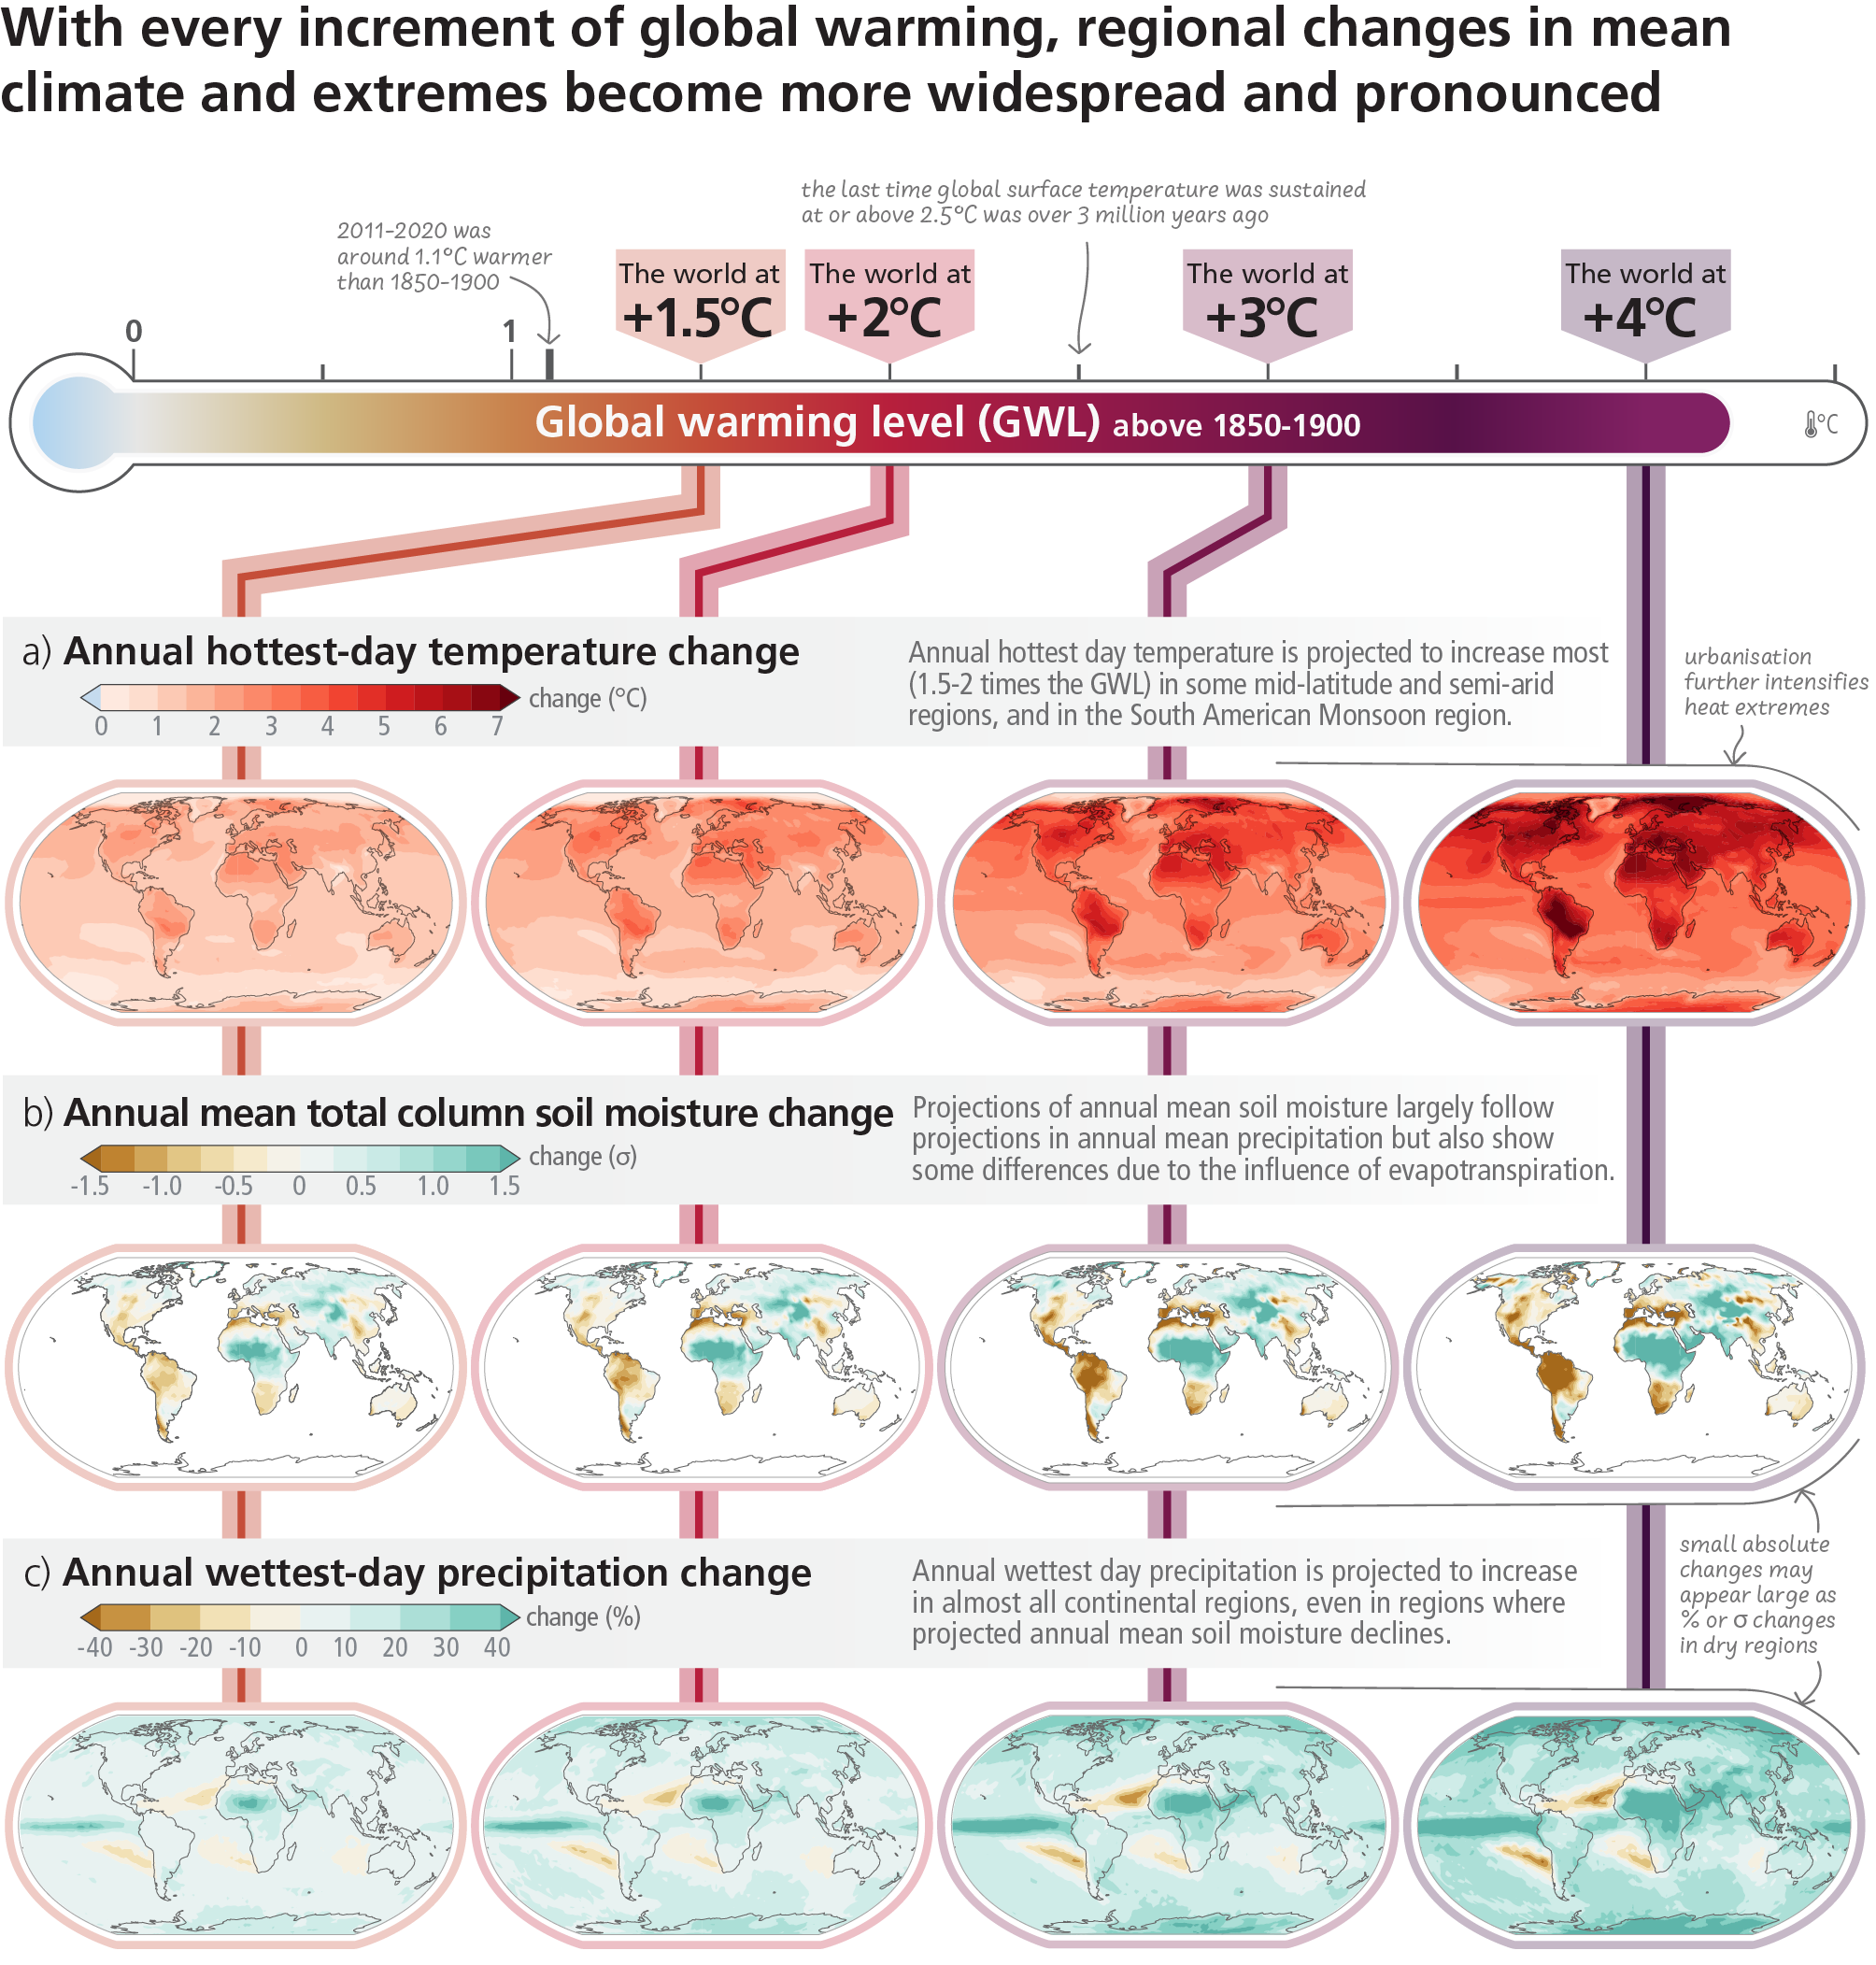
Figure SPM.2: Projected changes of annual maximum daily maximum temperature, annual mean total column soil moisture and annual maximum 1-day precipitation at global warming levels of 1.5°C, 2°C, 3°C, and 4°C relative to 1850-1900. Projected (a) annual maximum daily temperature change (°C), (b) annual mean total column soil moisture (standard deviation), (c) annual maximum 1-day precipitation change (%). The panels show CMIP6 multi-model median changes. In panels (b) and (c), large positive relative changes in dry regions may correspond to small absolute changes. In panel (b), the unit is the standard deviation of interannual variability in soil moisture during 1850-1900. Standard deviation is a widely used metric in characterising drought severity. A projected reduction in mean soil moisture by one standard deviation corresponds to soil moisture conditions typical of droughts that occurred about once every six years during 1850-1900. The WGI Interactive Atlas (https://interactive-atlas.ipcc.ch/) can be used to explore additional changes in the climate system across the range of global warming levels presented in this figure. Links to longer reportFigure 3.1, Cross-Section Box.2
Climate Change Impacts and Climate-Related Risks
B.2 For any given future warming level, many climate-related risks are higher than assessed in AR5, and projected long-term impacts are up to multiple times higher than currently observed (high confidence). Risks and projected adverse impacts and related losses and damages from climate change escalate with every increment of global warming (very high confidence). Climatic and non-climatic risks will increasingly interact, creating compound and cascading risks that are more complex and difficult to manage (high confidence). Expand Figure SPM.3 Figure SPM.4 Links to longer reportCross-Section Box.2, 3.1, 4.3, Figure 3.3, Figure 4.3
B.2.1 In the near term, every region in the world is projected to face further increases in climate hazards (medium to high confidence, depending on region and hazard), increasing multiple risks to ecosystems and humans (very high confidence). Hazards and associated risks expected in the near-term include an increase in heat-related human mortality and morbidity (high confidence), food-borne, water-borne, and vector-borne diseases (high confidence), and mental health challenges 36 (very high confidence), flooding in coastal and other low-lying cities and regions (high confidence), biodiversity loss in land, freshwater and ocean ecosystems (medium to very high confidence, depending on ecosystem), and a decrease in food production in some regions (high confidence). Cryosphere-related changes in floods, landslides, and water availability have the potential to lead to severe consequences for people, infrastructure and the economy in most mountain regions (high confidence). The projected increase in frequency and intensity of heavy precipitation (high confidence) will increase rain-generated local flooding (medium confidence). Figure SPM.3 Figure SPM.4 Links to longer reportFigure 3.2, Figure 3.3, 4.3, Figure 4.3
B.2.2 Risks and projected adverse impacts and related losses and damages from climate change will escalate with every increment of global warming (very high confidence). They are higher for global warming of 1.5°C than at present, and even higher at 2°C (high confidence). Compared to the AR5, global aggregated risk levels 37 (Reasons for Concern 38 ) are assessed to become high to very high at lower levels of global warming due to recent evidence of observed impacts, improved process understanding, and new knowledge on exposure and vulnerability of human and natural systems, including limits to adaptation (high confidence). Due to unavoidable sea level rise (see also B.3), risks for coastal ecosystems, people and infrastructure will continue to increase beyond 2100 (high confidence). Figure SPM.3 Figure SPM.4 Links to longer report3.1.2, 3.1.3, Figure 3.4, Figure 4.3
B.2.3 With further warming, climate change risks will become increasingly complex and more difficult to manage. Multiple climatic and non-climatic risk drivers will interact, resulting in compounding overall risk and risks cascading across sectors and regions. Climate-driven food insecurity and supply instability, for example, are projected to increase with increasing global warming, interacting with non-climatic risk drivers such as competition for land between urban expansion and food production, pandemics and conflict. (high confidence)Links to longer report3.1.2, 4.3, Figure 4.3
B.2.4 For any given warming level, the level of risk will also depend on trends in vulnerability and exposure of humans and ecosystems. Future exposure to climatic hazards is increasing globally due to socio-economic development trends including migration, growing inequality and urbanisation. Human vulnerability will concentrate in informal settlements and rapidly growing smaller settlements. In rural areas vulnerability will be heightened by high reliance on climate-sensitive livelihoods. Vulnerability of ecosystems will be strongly influenced by past, present, and future patterns of unsustainable consumption and production, increasing demographic pressures, and persistent unsustainable use and management of land, ocean, and water. Loss of ecosystems and their services has cascading and long-term impacts on people globally, especially for Indigenous Peoples and local communities who are directly dependent on ecosystems, to meet basic needs. (high confidence) Links to longer reportCross-Section Box.2, Figure 1c, 3.1.2, 4.3
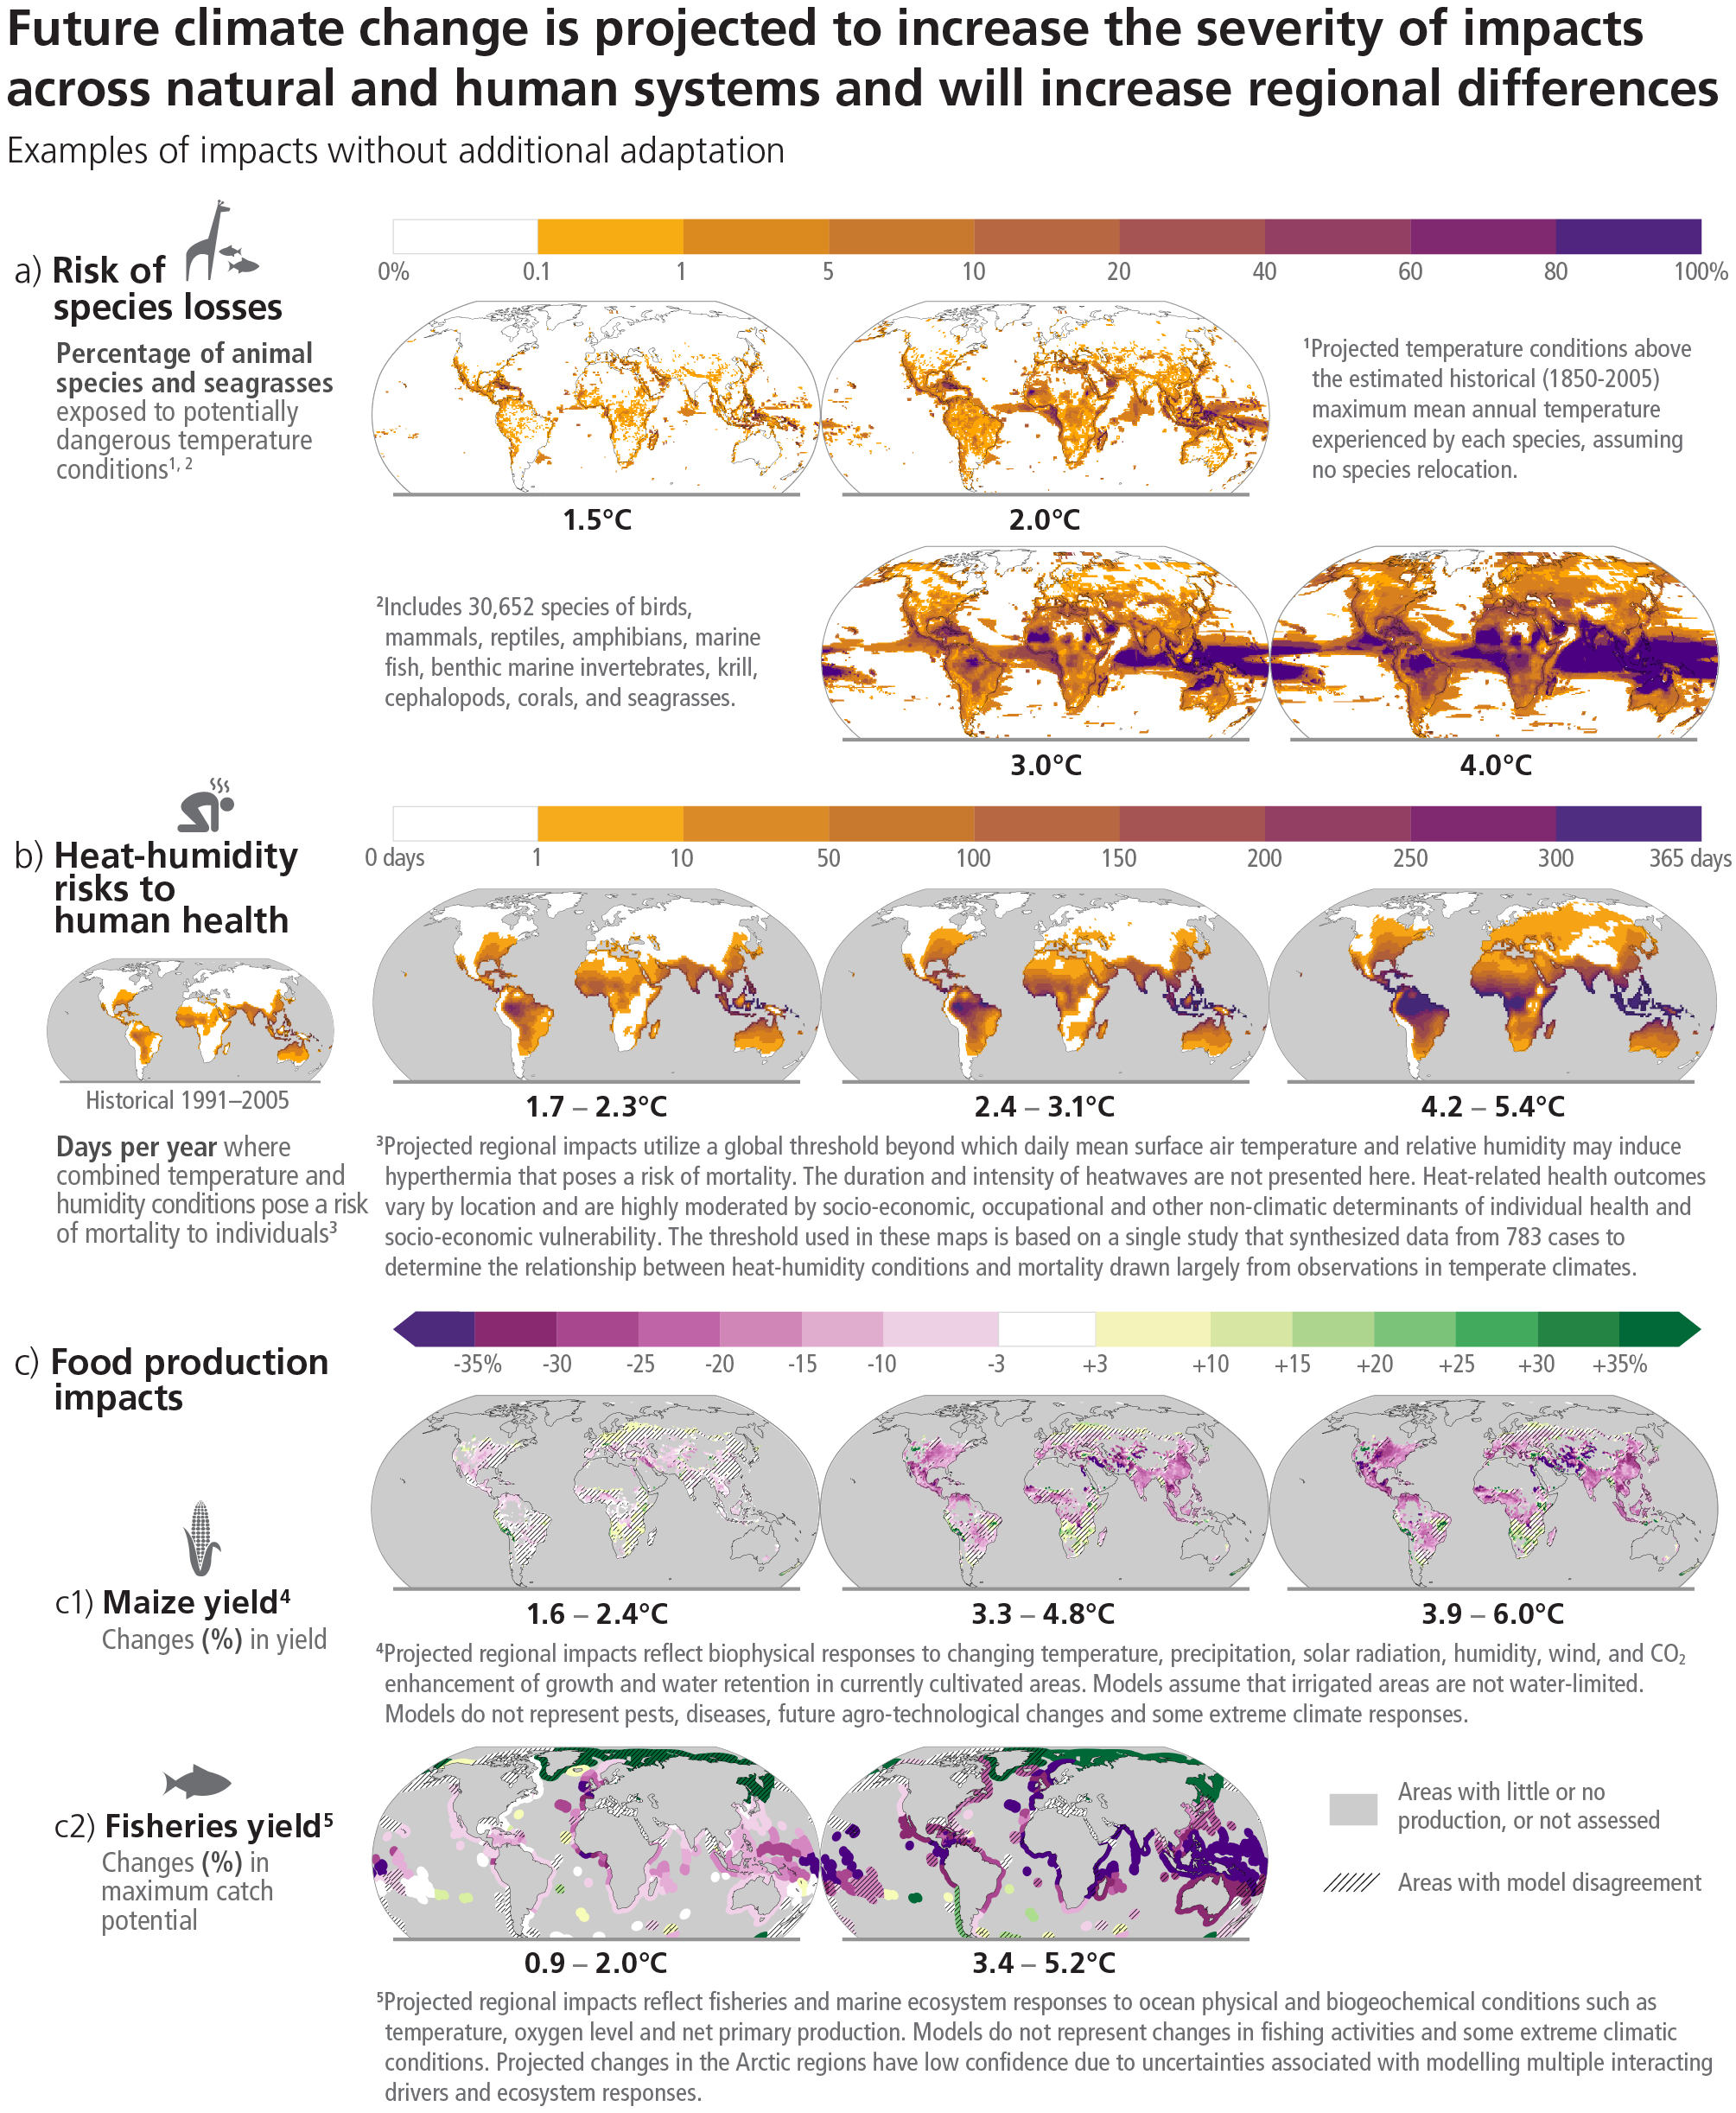
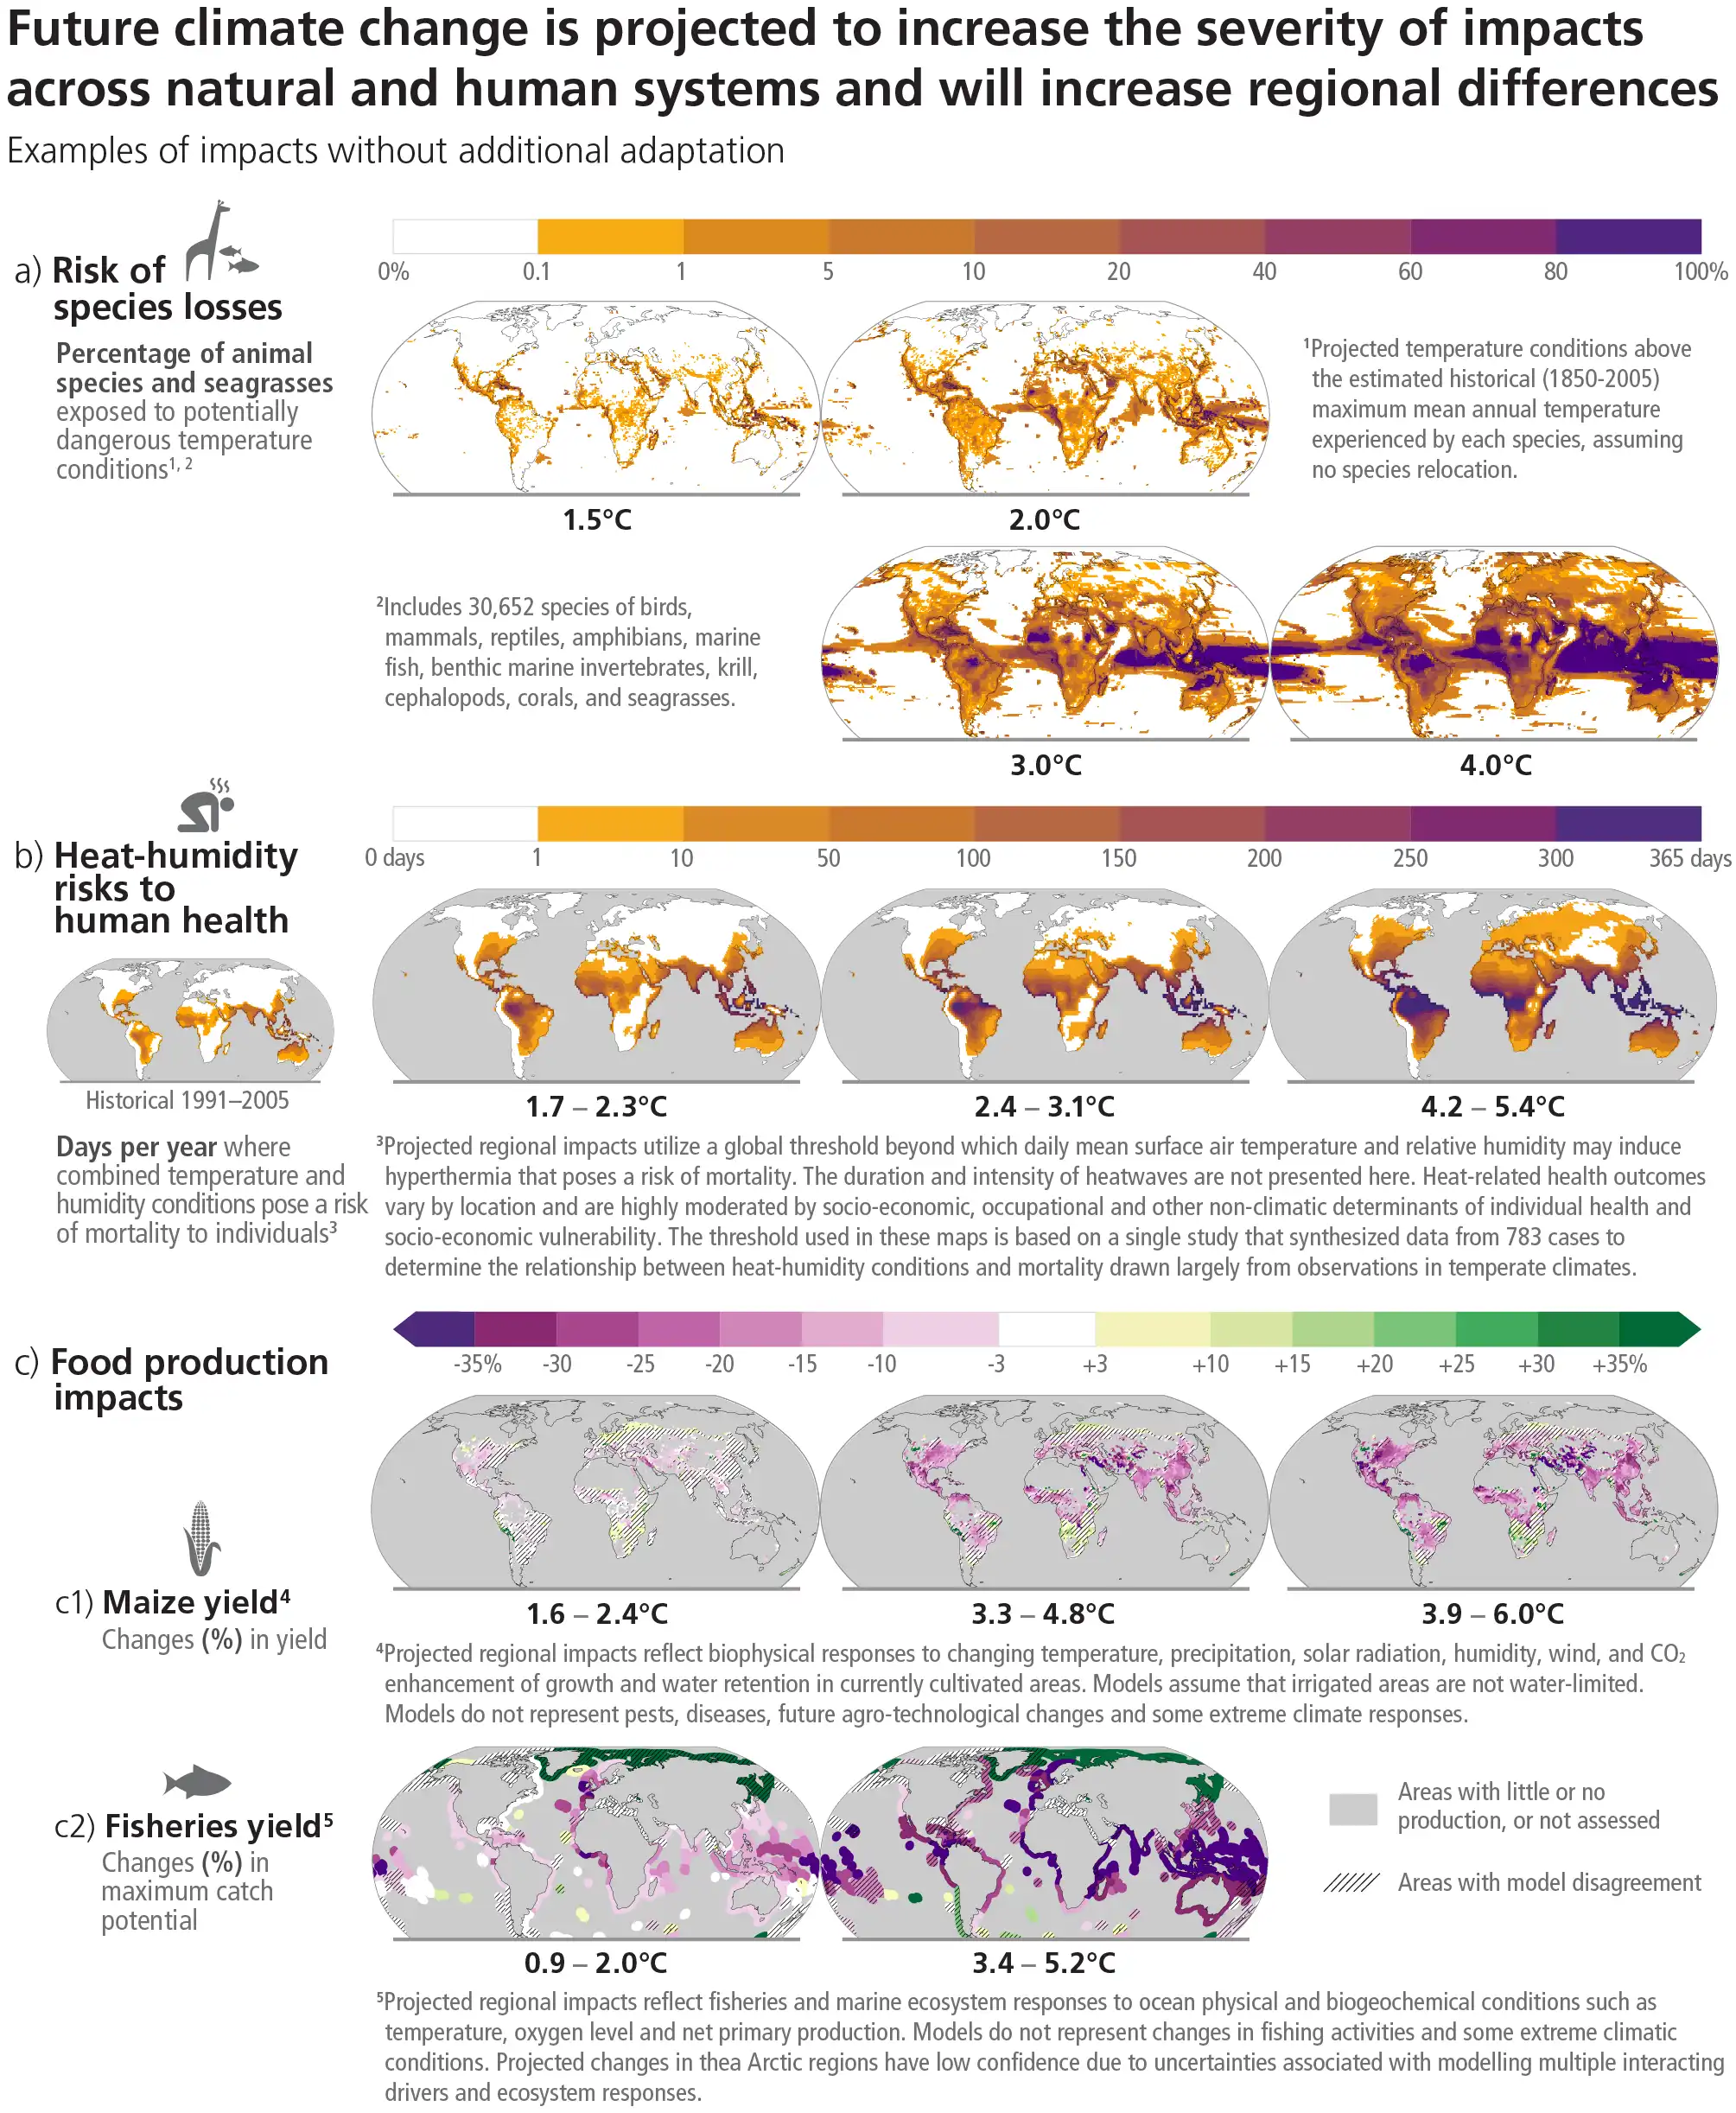
Figure SPM.3: Projected risks and impacts of climate change on natural and human systems at different global warming levels (GWLs) relative to 1850-1900 levels. Projected risks and impacts shown on the maps are based on outputs from different subsets of Earth system and impact models that were used to project each impact indicator without additional adaptation. WGII provides further assessment of the impacts on human and natural systems using these projections and additional lines of evidence. (a) Risks of species losses as indicated by the percentage of assessed species exposed to potentially dangerous temperature conditions, as defined by conditions beyond the estimated historical (1850-2005) maximum mean annual temperature experienced by each species, at GWLs of 1.5°C, 2°C,3°C and 4°C. Underpinning projections of temperature are from 21 Earth system models and do not consider extreme events impacting ecosystems such as the Arctic. (b) Risks to human health as indicated by the days per year of population exposure to hyperthermic conditions that pose a risk of mortality from surface air temperature and humidity conditions for historical period (1991-2005) and at GWLs of 1.7°C–2.3°C (mean = 1.9°C; 13 climate models), 2.4°C–3.1°C (2.7°C; 16 climate models) and 4.2°C–5.4°C (4.7°C; 15 climate models). Interquartile ranges of GWLs by 2081-2100 under RCP2.6, RCP4.5 and RCP8.5. The presented index is consistent with common features found in many indices included within WGI and WGII assessments. (c) Impacts on food production: (c1) Changes in maize yield by 2080-2099 relative to 1986-2005 at projected GWLs of 1.6°C–2.4°C (2.0°C), 3.3°C–4.8°C (4.1°C) and 3.9°C–6.0°C (4.9°C). Median yield changes from an ensemble of 12 crop models, each driven by bias-adjusted outputs from 5 Earth system models, from the Agricultural Model Intercomparison and Improvement Project (AgMIP) and the Inter-Sectoral Impact Model Intercomparison Project (ISIMIP). Maps depict 2080-2099 compared to 1986-2005 for current growing regions (>10 ha), with the corresponding range of future global warming levels shown under SSP1-2.6, SSP3-7.0 and SSP5-8.5, respectively. Hatching indicates areas where <70% of the climate-crop model combinations agree on the sign of impact. (c2) Change in maximum fisheries catch potential by 2081-2099 relative to 1986-2005 at projected GWLs of 0.9°C–2.0°C (1.5°C) and 3.4°C–5.2°C (4.3°C). GWLs by 2081-2100 under RCP2.6 and RCP8.5. Hatching indicates where the two climate-fisheries models disagree in the direction of change. Large relative changes in low yielding regions may correspond to small absolute changes. Biodiversity and fisheries in Antarctica were not analysed due to data limitations. Food security is also affected by crop and fishery failures not presented here. Box SPM.1 Links to longer report3.1.2, Figure 3.2, Cross-Section Box.2
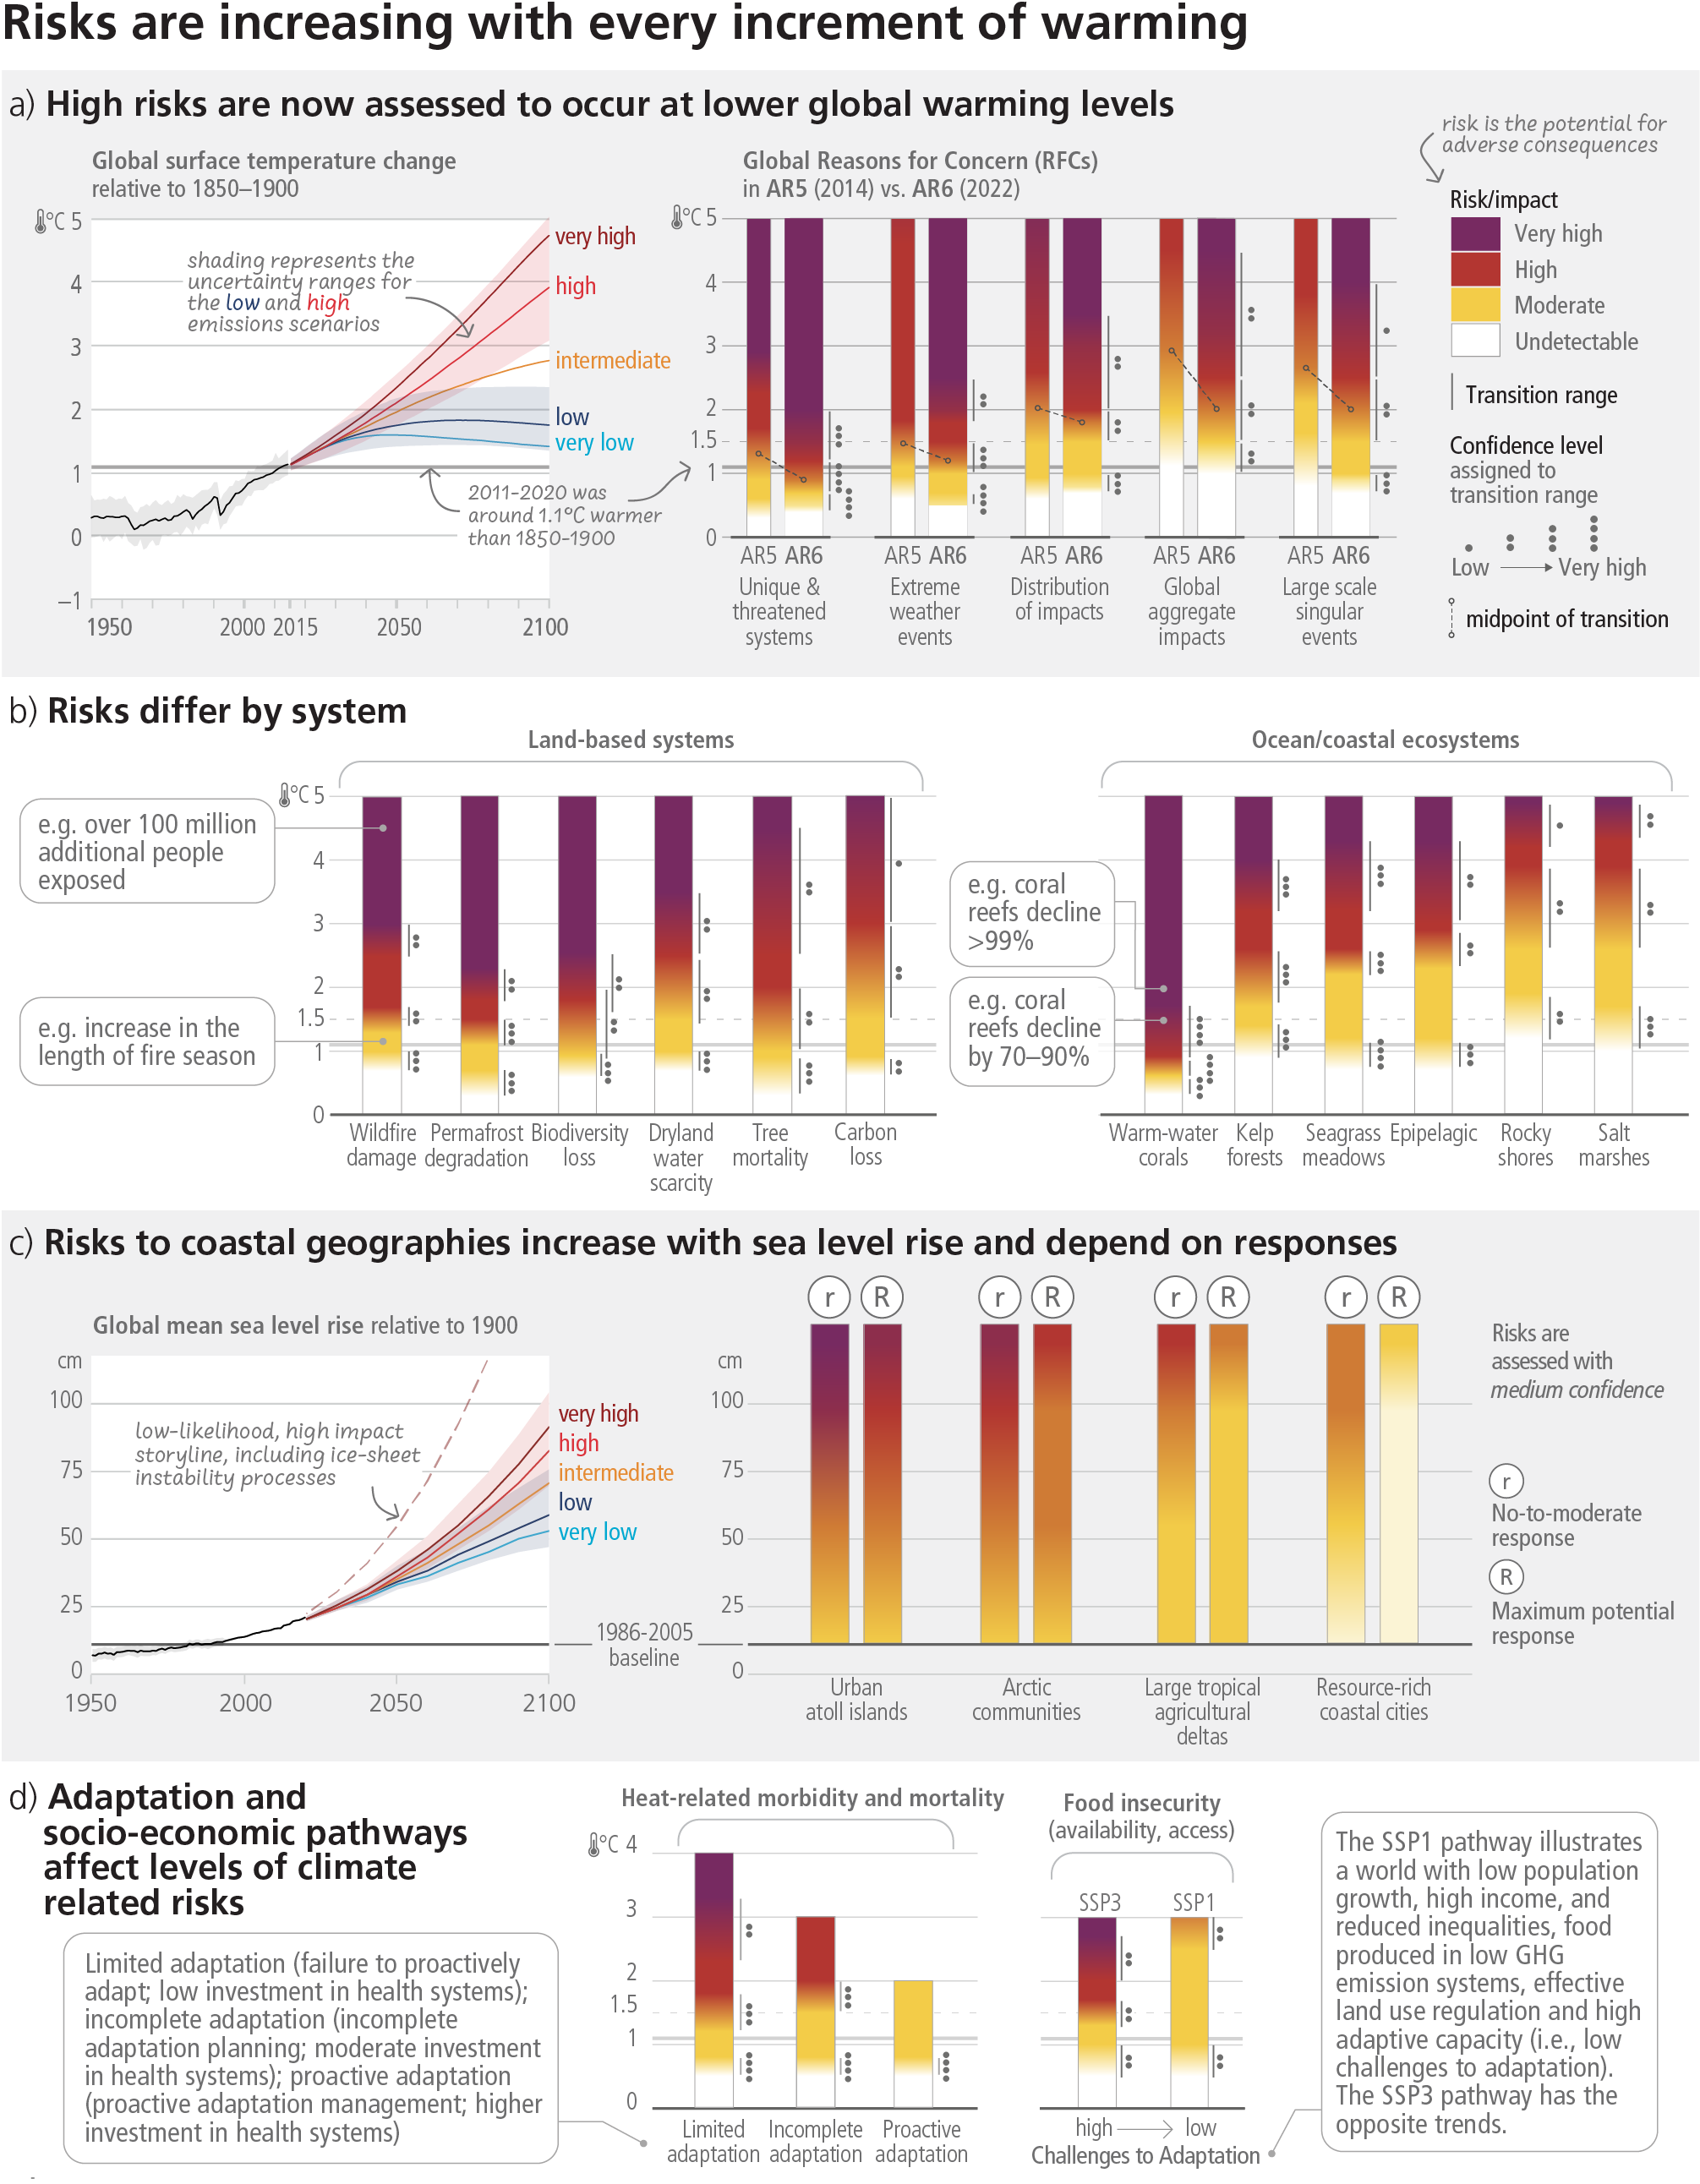
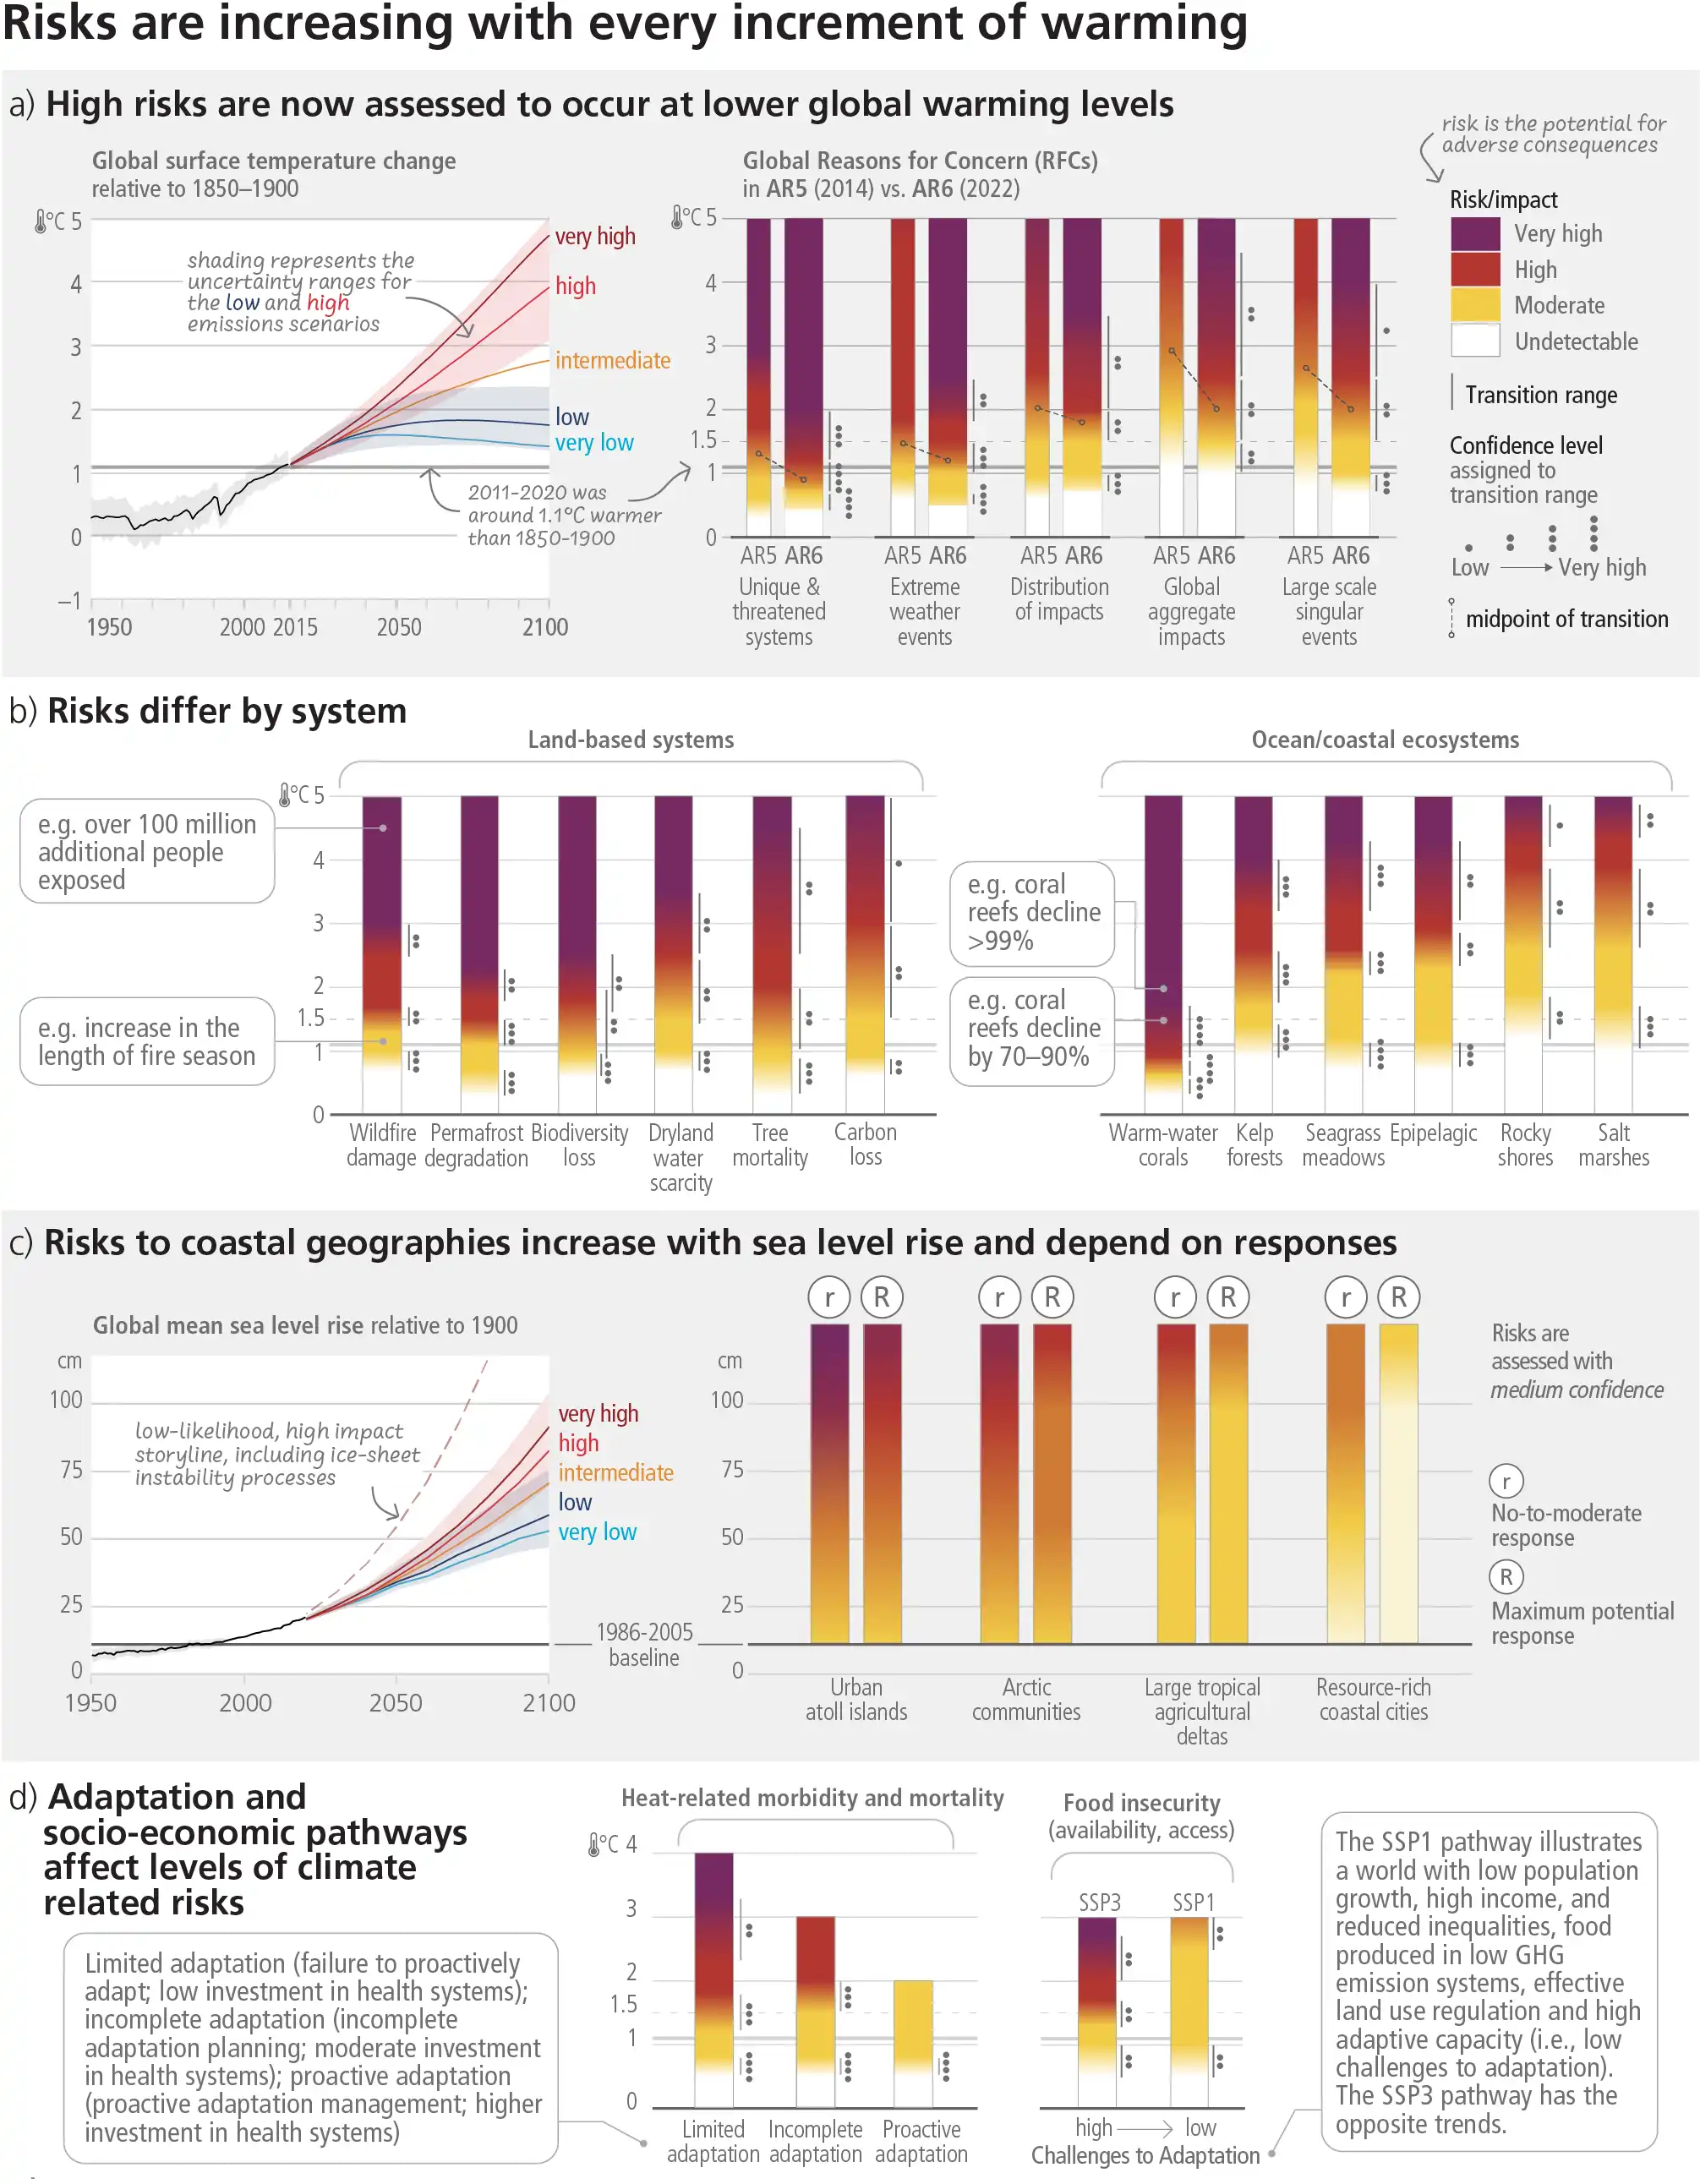
Figure SPM.4: Subset of assessed climate outcomes and associated global and regional climate risks. The burning embers result from a literature based expert elicitation. Panel (a): Left – Global surface temperature changes in °C relative to 1850-1900. These changes were obtained by combining CMIP6 model simulations with observational constraints based on past simulated warming, as well as an updated assessment of equilibrium climate sensitivity. Verylikely ranges are shown for the low and high GHG emissions scenarios (SSP1-2.6 and SSP3-7.0) (Cross-Section Box.2). Right – Global Reasons for Concern (RFC), comparing AR6 (thick embers) and AR5 (thin embers) assessments. Risk transitions have generally shifted towards lower temperatures with updated scientific understanding. Diagrams are shown for each RFC, assuming low to no adaptation. Lines connect the midpoints of the transitions from moderate to high risk across AR5 and AR6. Panel (b) : Selected global risks for land and ocean ecosystems, illustrating general increase of risk with global warming levels with low to no adaptation. Panel (c): Left - Global mean sea level change in centimetres, relative to 1900. The historical changes (black) are observed by tide gauges before 1992 and altimeters afterwards. The future changes to 2100 (coloured lines and shading) are assessed consistently with observational constraints based on emulation of CMIP, ice-sheet, and glacier models, and likely ranges are shown for SSP1-2.6 and SSP3-7.0. Right - Assessment of the combined risk of coastal flooding, erosion and salinization for four illustrative coastal geographies in 2100, due to changing mean and extreme sea levels, under two response scenarios, with respect to the SROCC baseline period (1986-2005). The assessment does not account for changes in extreme sea level beyond those directly induced by mean sea level rise; risk levels could increase if other changes in extreme sea levels were considered (e.g., due to changes in cyclone intensity). “No-to-moderate response” describes efforts as of today (i.e., no further significant action or new types of actions). “Maximum potential response” represent a combination of responses implemented to their full extent and thus significant additional efforts compared to today, assuming minimal financial, social and political barriers. (In this context, ‘today’ refers to 2019.) The assessment criteria include exposure and vulnerability, coastal hazards, in-situ responses and planned relocation. Planned relocation refers to managed retreat or resettlements. The term response is used here instead of adaptation because some responses, such as retreat, may or may not be considered to be adaptation. Panel (d) : Selected risks under different socio-economic pathways, illustrating how development strategies and challenges to adaptation influence risk. Left - Heat-sensitive human health outcomes under three scenarios of adaptation effectiveness. The diagrams are truncated at the nearest whole ºC within the range of temperature change in 2100 under three SSP scenarios. Right - Risks associated with food security due to climate change and patterns of socio-economic development. Risks to food security include availability and access to food, including population at risk of hunger, food price increases and increases in disability adjusted life years attributable to childhood underweight. Risks are assessed for two contrasted socio-economic pathways (SSP1 and SSP3) excluding the effects of targeted mitigation and adaptation policies.Expand Box SPM.1 Links to longer reportFigure 3.3
Likelihood and Risks of Unavoidable, Irreversible or Abrupt Changes
B.3 Some future changes are unavoidable and/or irreversible but can be limited by deep, rapid and sustained global greenhouse gas emissions reduction. The likelihood of abrupt and/or irreversible changes increases with higher global warming levels. Similarly, the probability of low-likelihood outcomes associated with potentially very large adverse impacts increases with higher global warming levels. (high confidence)ExpandLinks to longer report3.1
B.3.1 Limiting global surface temperature does not prevent continued changes in climate system components that have multi-decadal or longer timescales of response (high confidence). Sea level rise is unavoidable for centuries to millennia due to continuing deep ocean warming and ice sheet melt, and sea levels will remain elevated for thousands of years (high confidence). However, deep, rapid and sustained GHG emissions reductions would limit further sea level rise acceleration and projected long-term sea level rise commitment. Relative to 1995-2014, the likely global mean sea level rise under the SSP1-1.9 GHG emissions scenario is 0.15–0.23 m by 2050 and 0.28–0.55 m by 2100; while for the SSP5-8.5 GHG emissions scenario it is 0.20–0.29 m by 2050 and 0.63–1.01 m by 2100 (medium confidence). Over the next 2000 years, global mean sea level will rise by about 2–3 m if warming is limited to 1.5°C and 2–6 m if limited to 2°C (low confidence). Box SPM.1 Links to longer report3.1.3, Figure 3.4
B.3.2 The likelihood and impacts of abrupt and/or irreversible changes in the climate system, including changes triggered when tipping points are reached, increase with further global warming (high confidence). As warming levels increase, so do the risks of species extinction or irreversible loss of biodiversity in ecosystems including forests (medium confidence), coral reefs (very high confidence) and in Arctic regions (high confidence). At sustained warming levels between 2°C and 3°C, the Greenland and West Antarctic ice sheets will be lost almost completely and irreversibly over multiple millennia, causing several metres of sea level rise (limited evidence). The probability and rate of ice mass loss increase with higher global surface temperatures (high confidence). Links to longer report3.1.2, 3.1.3
B.3.3 The probability of low-likelihood outcomes associated with potentially very large impacts increases with higher global warming levels (high confidence). Due to deep uncertainty linked to ice-sheet processes, global mean sea level rise above the likely range – approaching 2 m by 2100 and in excess of 15 m by 2300 under the very high GHG emissions scenario (SSP5-8.5) (low confidence) – cannot be excluded. There is medium confidence that the Atlantic Meridional Overturning Circulation will not collapse abruptly before 2100, but if it were to occur, it would verylikely cause abrupt shifts in regional weather patterns, and large impacts on ecosystems and human activities. Box SPM.1 Links to longer report3.1.3
Adaptation Options and their Limits in a Warmer World
B.4 Adaptation options that are feasible and effective today will become constrained and less effective with increasing global warming. With increasing global warming, losses and damages will increase and additional human and natural systems will reach adaptation limits. Maladaptation can be avoided by flexible, multi-sectoral, inclusive, long-term planning and implementation of adaptation actions, with co-benefits to many sectors and systems. (high confidence) ExpandLinks to longer report3.2, 4.1, 4.2, 4.3
B.4.1 The effectiveness of adaptation, including ecosystem-based and most water-related options, will decrease with increasing warming. The feasibility and effectiveness of options increase with integrated, multi-sectoral solutions that differentiate responses based on climate risk, cut across systems and address social inequities. As adaptation options often have long implementation times, long-term planning increases their efficiency. (high confidence) Links to longer report3.2, Figure 3.4, 4.1, 4.2
B.4.2 With additional global warming, limits to adaptation and losses and damages, strongly concentrated among vulnerable populations, will become increasingly difficult to avoid (high confidence). Above 1.5°C of global warming, limited freshwater resources pose potential hard adaptation limits for small islands and for regions dependent on glacier and snow melt (medium confidence). Above that level, ecosystems such as some warm-water coral reefs, coastal wetlands, rainforests, and polar and mountain ecosystems will have reached or surpassed hard adaptation limits and as a consequence, some Ecosystem-based Adaptation measures will also lose their effectiveness (high confidence). Links to longer report2.3.2, 3.2, 4.3
B.4.3 Actions that focus on sectors and risks in isolation and on short-term gains often lead to maladaptation over the long-term, creating lock-ins of vulnerability, exposure and risks that are difficult to change. For example, seawalls effectively reduce impacts to people and assets in the short-term but can also result in lock-ins and increase exposure to climate risks in the long-term unless they are integrated into a long-term adaptive plan. Maladaptive responses can worsen existing inequities especially for Indigenous Peoples and marginalised groups and decrease ecosystem and biodiversity resilience. Maladaptation can be avoided by flexible, multi-sectoral, inclusive, long-term planning and implementation of adaptation actions, with co-benefits to many sectors and systems. (high confidence) Links to longer report2.3.2, 3.2
Carbon Budgets and Net Zero Emissions
B.5 Limiting human-caused global warming requires net zero CO2 emissions. Cumulative carbon emissions until the time of reaching net zero CO2 emissions and the level of greenhouse gas emission reductions this decade largely determine whether warming can be limited to 1.5°C or 2°C (high confidence). Projected CO2 emissions from existing fossil fuel infrastructure without additional abatement would exceed the remaining carbon budget for 1.5°C (50%) (high confidence).ExpandLinks to longer report2.3, 3.1, 3.3, Table 3.1
B.5.1 From a physical science perspective, limiting human-caused global warming to a specific level requires limiting cumulative CO2 emissions, reaching at least net zero CO2 emissions, along with strong reductions in other greenhouse gas emissions. Reaching net zero GHG emissions primarily requires deep reductions in CO2, methane, and other GHG emissions, and implies net-negative CO2 emissions 39 . Carbon dioxide removal (CDR) will be necessary to achieve net-negative CO2 emissions (see B.6). Net zero GHG emissions, if sustained, are projected to result in a gradual decline in global surface temperatures after an earlier peak. (high confidence) Links to longer report3.1.1, 3.3.1, 3.3.2, 3.3.3, Table 3.1, Cross-Section Box.1
B.5.2 For every 1000 GtCO2 emitted by human activity, global surface temperature rises by 0.45°C (best estimate, with a likely range from 0.27°C to 0.63°C). The best estimates of the remaining carbon budgets from the beginning of 2020 are 500 GtCO2 for a 50% likelihood of limiting global warming to 1.5°C and 1150 GtCO2 for a 67% likelihood of limiting warming to 2°C40 . The stronger the reductions in non-CO2 emissions the lower the resulting temperatures are for a given remaining carbon budget or the larger remaining carbon budget for the same level of temperature change 41 . Links to longer report3.3.1
B.5.3 If the annual CO2 emissions between 2020-2030 stayed, on average, at the same level as 2019, the resulting cumulative emissions would almost exhaust the remaining carbon budget for 1.5°C (50%), and deplete more than a third of the remaining carbon budget for 2°C (67%). Estimates of future CO2 emissions from existing fossil fuel infrastructures without additional abatement 42 already exceed the remaining carbon budget for limiting warming to 1.5°C (50%) (high confidence). Projected cumulative future CO2 emissions over the lifetime of existing and planned fossil fuel infrastructure, if historical operating patterns are maintained and without additional abatement 43 , are approximately equal to the remaining carbon budget for limiting warming to 2°C with a likelihood of 83%44 (high confidence). Links to longer report2.3.1, 3.3.1, Figure 3.5
B.5.4 Based on central estimates only, historical cumulative net CO2 emissions between 1850 and 2019 amount to about four-fifths 45 of the total carbon budget for a 50% probability of limiting global warming to 1.5°C (central estimate about 2900 GtCO2), and to about two thirds 46 of the total carbon budget for a 67% probability to limit global warming to 2°C (central estimate about 3550 GtCO2). Links to longer report3.3.1, Figure 3.5
Mitigation Pathways
B.6 All global modelled pathways that limit warming to 1.5°C (>50%) with no or limited overshoot, and those that limit warming to 2°C (>67%), involve rapid and deep and, in most cases, immediate greenhouse gas emissions reductions in all sectors this decade. Global net zero CO2 emissions are reached for these pathway categories, in the early 2050s and around the early 2070s, respectively. (high confidence) Expand Figure SPM.5 Box SPM.1Links to longer report3.3, 3.4, 4.1, 4.5, Table 3.1
B.6.1 Global modelled pathways provide information on limiting warming to different levels; these pathways, particularly their sectoral and regional aspects, depend on the assumptions described in Box SPM.1. Global modelled pathways that limit warming to 1.5°C (>50%) with no or limited overshoot or limit warming to 2°C (>67%) are characterized by deep, rapid and, in most cases, immediate GHG emissions reductions. Pathways that limit warming to 1.5C (>50%) with no or limited overshoot reach net zero CO2 in the early 2050s, followed by net negative CO2 emissions. Those pathways that reach net zero GHG emissions do so around the 2070s. Pathways that limit warming to 2C (>67%) reach net zero CO2 emissions in the early 2070s. Global GHG emissions are projected to peak between 2020 and at the latest before 2025 in global modelled pathways that limit warming to 1.5°C (>50%) with no or limited overshoot and in those that limit warming to 2°C (>67%) and assume immediate action. (high confidence)  Table SPM.1Links to longer report3.3.2, 3.3.4, 4.1, Table 3.1, Figure 3.6
Table SPM.1: Greenhouse gas and CO2 emission reductions from 2019, median and 5-95 percentiles. Links to longer report3.3.1, 4.1, Table 3.1, Figure 2.5, Box SPM.1
Reductions from 2019 emission levels (%) | |||||
2030 | 2035 | 2040 | 2050 | ||
Limit warming to1.5°C (>50%) with no or limited overshoot | GHS | 43 [34-60] | 60 [49-77] | 69 [58-90] | 84 [73-98] |
CO2 | 48 [36-69] | 65 [50-96] | 80 [61-109] | 99 [79-119] | |
Limit warming to 2°C (>67%) | GHG | 21 [1-42] | 35 [22-55] | 46 [34-63] | 64 [53-77] |
CO2 | 22 [1-44] | 37 [21-59] | 51 [36-70] | 73 [55-90] | |
B.6.2 Reaching net zero CO2 or GHG emissions primarily requires deep and rapid reductions in gross emissions of CO2, as well as substantial reductions of non-CO2GHG emissions (high confidence). For example, in modelled pathways that limit warming to 1.5°C (>50%) with no or limited overshoot, global methane emissions are reduced by 34 [21–57] % by 2030 relative to 2019. However, some hard-to-abate residual GHG emissions (e.g., some emissions from agriculture, aviation, shipping, and industrial processes) remain and would need to be counterbalanced by deployment of CDR methods to achieve net zero CO2 or GHG emissions (high confidence). As a result, net zero CO2 is reached earlier than net zero GHGs (high confidence). Figure SPM.5 Links to longer report3.3.2, 3.3.3, Table 3.1, Figure 3.5
B.6.3 Global modelled mitigation pathways reaching net zero CO2 and GHG emissions include transitioning from fossil fuels without carbon capture and storage (CCS) to very low- or zero-carbon energy sources, such as renewables or fossil fuels with CCS, demand-side measures and improving efficiency, reducing non-CO2GHG emissions, and, and CDR47 . In most global modelled pathways, land-use change and forestry (via reforestation and reduced deforestation) and the energy supply sector reach net zero CO2 emissions earlier than the buildings, industry and transport sectors. (high confidence) Figure SPM.5 Box SPM.1Links to longer report3.3.3, 4.1, 4.5, Figure 4.1
B.6.4 Mitigation options often have synergies with other aspects of sustainable development, but some options can also have trade-offs. There are potential synergies between sustainable development and, for instance, energy efficiency and renewable energy. Similarly, depending on the context 48 , biological CDR methods like reforestation, improved forest management, soil carbon sequestration, peatland restoration and coastal blue carbon management can enhance biodiversity and ecosystem functions, employment and local livelihoods. However, afforestation or production of biomass crops can have adverse socio-economic and environmental impacts, including on biodiversity, food and water security, local livelihoods and the rights of Indigenous Peoples, especially if implemented at large scales and where land tenure is insecure. Modelled pathways that assume using resources more efficiently or that shift global development towards sustainability include fewer challenges, such as less dependence on CDR and pressure on land and biodiversity. (high confidence) Links to longer report3.4.1
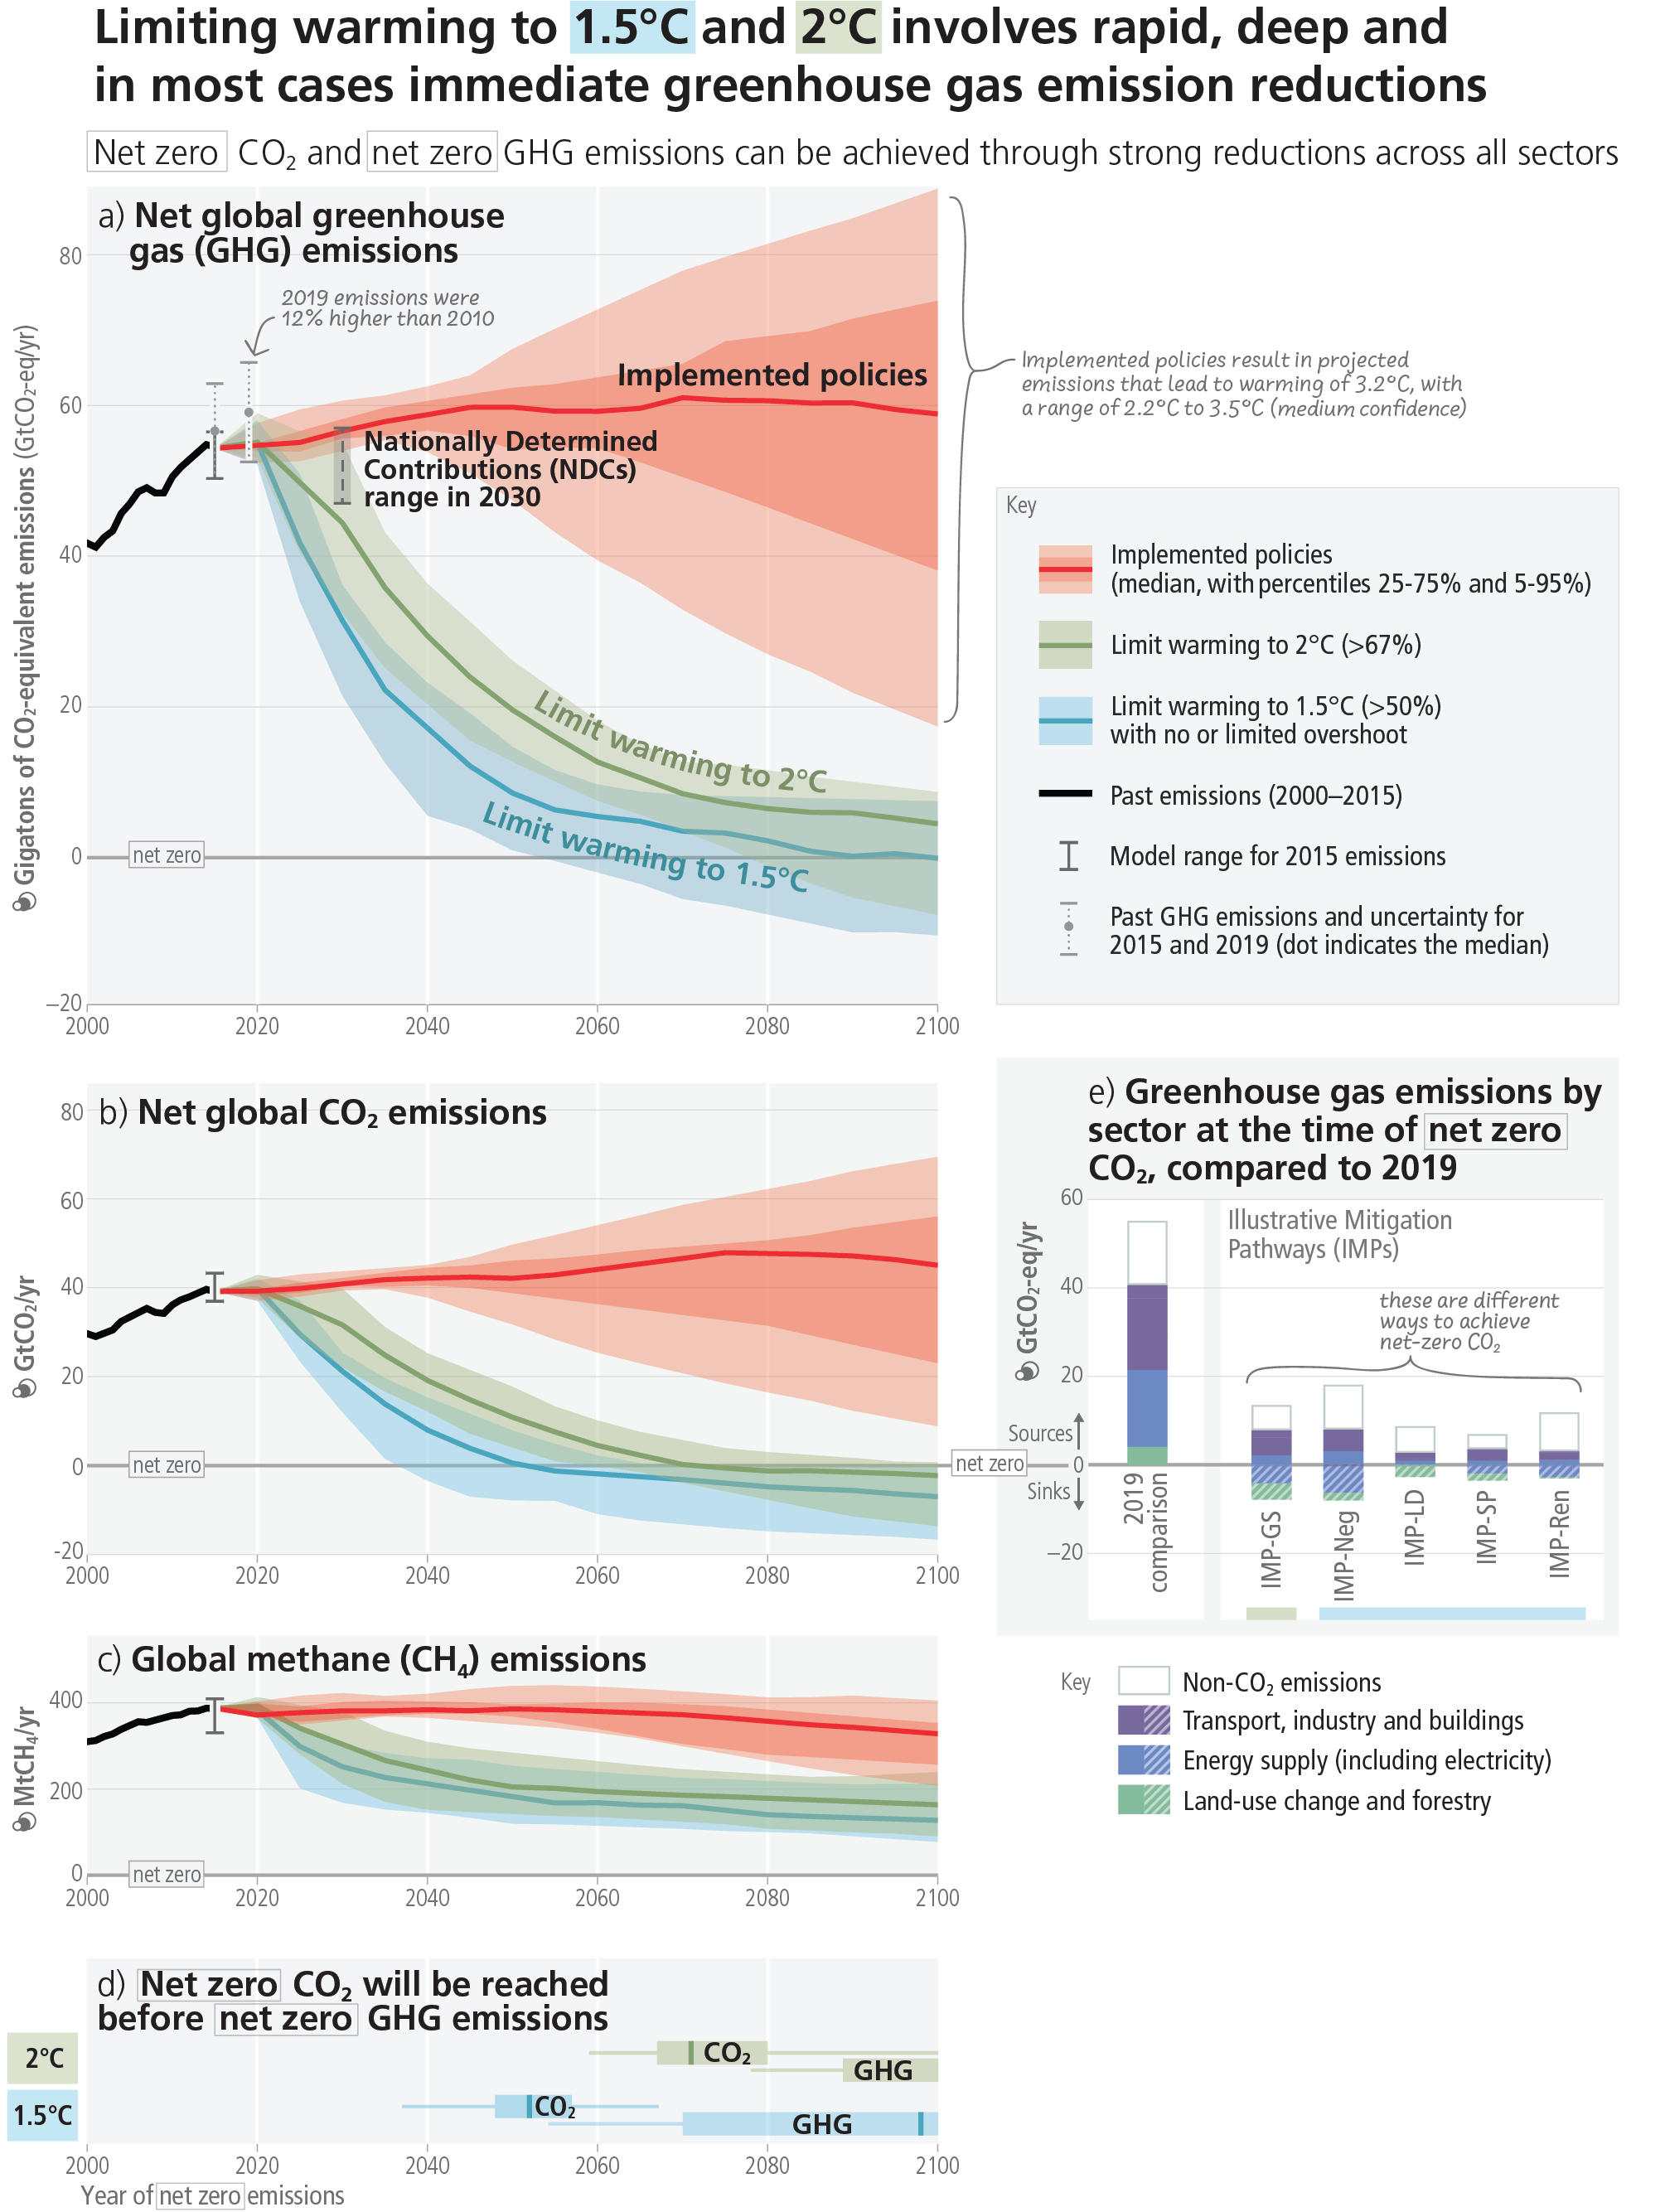
Figure SPM.5: Global emissions pathways consistent with implemented policies and mitigation strategies. Panels (a), (b) and (c) show the development of global GHG, CO2 and methane emissions in modelled pathways, while panel (d) shows the associated timing of when GHG and CO2 emissions reach net zero. Coloured ranges denote the 5th to 95th percentile across the global modelled pathways falling within a given category as described in Box SPM.1. The red ranges depict emissions pathways assuming policies that were implemented by the end of 2020. Ranges of modelled pathways that limit warming to 1.5°C (>50%) with no or limited overshoot are shown in light blue (category C1) and pathways that limit warming to 2°C (>67%) are shown in green (category C3). Global emission pathways that would limit warming to 1.5°C (>50%) with no or limited overshoot and also reach net zero GHG in the second half of the century do so between 2070-2075. Panel (e) shows the sectoral contributions of CO2 and non-CO2 emissions sources and sinks at the time when net zero CO2 emissions are reached in illustrative mitigation pathways (IMPs) consistent with limiting warming to 1.5°C with a high reliance on net negative emissions (IMP-Neg) (“high overshoot”), high resource efficiency (IMP-LD), a focus on sustainable development (IMP-SP), renewables (IMP-Ren) and limiting warming to 2°C with less rapid mitigation initially followed by a gradual strengthening (IMP-GS). Positive and negative emissions for different IMPs are compared to GHG emissions from the year 2019. Energy supply (including electricity) includes bioenergy with carbon dioxide capture and storage and direct air carbon dioxide capture and storage. CO2 emissions from land-use change and forestry can only be shown as a net number as many models do not report emissions and sinks of this category separately . Box SPM.1Links to longer reportFigure 3.6, 4.1
Overshoot: Exceeding a Warming Level and Returning
B.7 If warming exceeds a specified level such as 1.5°C, it could gradually be reduced again by achieving and sustaining net negative global CO2 emissions. This would require additional deployment of carbon dioxide removal, compared to pathways without overshoot, leading to greater feasibility and sustainability concerns. Overshoot entails adverse impacts, some irreversible, and additional risks for human and natural systems, all growing with the magnitude and duration of overshoot. (high confidence) ExpandLinks to longer report3.1, 3.3, 3.4, Table 3.1, Figure 3.6
B.7.1 Only a small number of the most ambitious global modelled pathways limit global warming to 1.5°C (>50%) by 2100 without exceeding this level temporarily. Achieving and sustaining net negative global CO2 emissions, with annual rates of CDR greater than residual CO2 emissions, would gradually reduce the warming level again (high confidence). Adverse impacts that occur during this period of overshoot and cause additional warming via feedback mechanisms, such as increased wildfires, mass mortality of trees, drying of peatlands, and permafrost thawing, weakening natural land carbon sinks and increasing releases of GHGs would make the return more challenging (medium confidence). Box SPM.1 Links to longer report3.3.2, 3.3.4, Table 3.1, Figure 3.6
B.7.2 The higher the magnitude and the longer the duration of overshoot, the more ecosystems and societies are exposed to greater and more widespread changes in climatic impact-drivers, increasing risks for many natural and human systems. Compared to pathways without overshoot, societies would face higher risks to infrastructure, low-lying coastal settlements, and associated livelihoods. Overshooting 1.5°C will result in irreversible adverse impacts on certain ecosystems with low resilience, such as polar, mountain, and coastal ecosystems, impacted by ice-sheet, glacier melt, or by accelerating and higher committed sea level rise. (high confidence) Links to longer report3.1.2, 3.3.4
B.7.3 The larger the overshoot, the more net negative CO2 emissions would be needed to return to 1.5°C by 2100. Transitioning towards net zero CO2 emissions faster and reducing non-CO2 emissions such as methane more rapidly would limit peak warming levels and reduce the requirement for net negative CO2 emissions, thereby reducing feasibility and sustainability concerns, and social and environmental risks associated with CDR deployment at large scales. (high confidence) Links to longer report3.3.3, 3.3.4, 3.4.1, Table 3.1
C. Responses in the Near Term
Urgency of Near-Term Integrated Climate Action
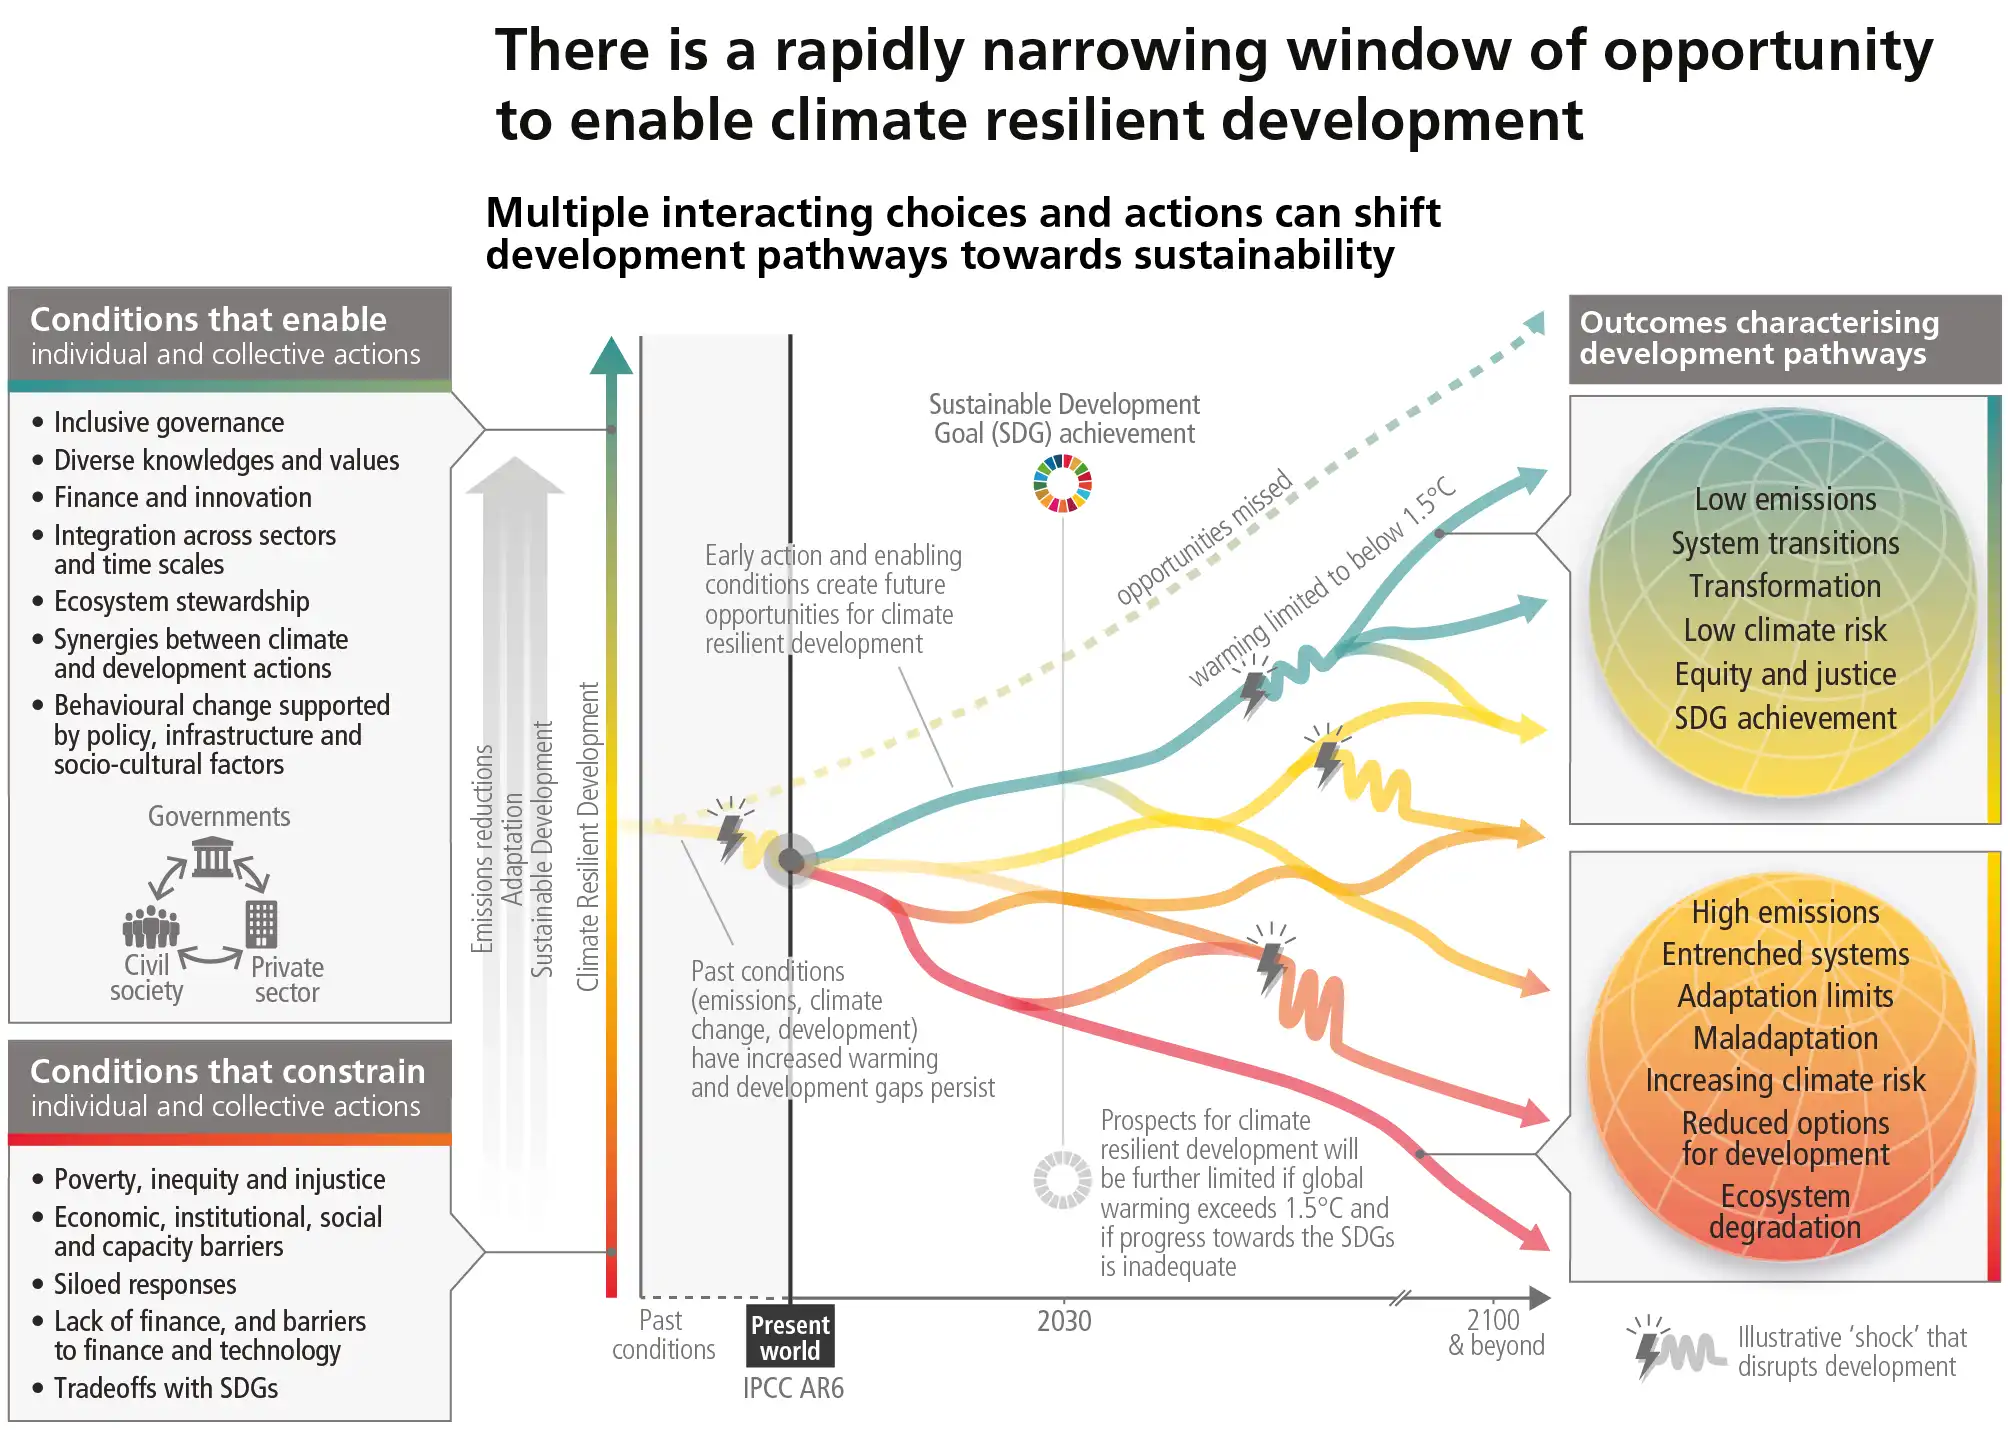
C.1 Climate change is a threat to human well-being and planetary health (very high confidence) . There is a rapidly closing window of opportunity to secure a liveable and sustainable future for all (very high confidence) . Climate resilient development integrates adaptation and mitigation to advance sustainable development for all, and is enabled by increased international cooperation including improved access to adequate financial resources, particularly for vulnerable regions, sectors and groups, and inclusive governance and coordinated policies (high confidence) . The choices and actions implemented in this decade will have impacts now and for thousands of years (high confidence). Expand Figure SPM.1 Figure SPM.6Links to longer report3.1, 3.3, 4.1, 4.2, 4.3, 4.4, 4.7, 4.8, 4.9, Figure 3.1, Figure 3.3, Figure 4.2
C.1.1 Evidence of observed adverse impacts and related losses and damages, projected risks, levels and trends in vulnerability and adaptation limits, demonstrate that worldwide climate resilient development action is more urgent than previously assessed in AR5. Climate resilient development integrates adaptation and GHG mitigation to advance sustainable development for all. Climate resilient development pathways have been constrained by past development, emissions and climate change and are progressively constrained by every increment of warming, in particular beyond 1.5°C. (very high confidence) Links to longer report3.4, 3.4.2, 4.1
C.1.2 Government actions at sub-national, national and international levels, with civil society and the private sector, play a crucial role in enabling and accelerating shifts in development pathways towards sustainability and climate resilient development (very high confidence). Climate resilient development is enabled when governments, civil society and the private sector make inclusive development choices that prioritize risk reduction, equity and justice, and when decision-making processes, finance and actions are integrated across governance levels, sectors, and timeframes (very high confidence). Enabling conditions are differentiated by national, regional and local circumstances and geographies, according to capabilities, and include: political commitment and follow-through, coordinated policies, social and international cooperation, ecosystem stewardship, inclusive governance, knowledge diversity, technological innovation, monitoring and evaluation, and improved access to adequate financial resources, especially for vulnerable regions, sectors and communities (high confidence). Figure SPM.6Links to longer report3.4, 4.2, 4.4, 4.5, 4.7, 4.8
C.1.3 Continued emissions will further affect all major climate system components, and many changes will be irreversible on centennial to millennial time scales and become larger with increasing global warming. Without urgent, effective, and equitable mitigation and adaptation actions, climate change increasingly threatens ecosystems, biodiversity, and the livelihoods, health and wellbeing of current and future generations. (high confidence) Figure SPM.1 Figure SPM.6Links to longer report3.1.3, 3.3.3, 3.4.1, Figure 3.4, 4.1, 4.2, 4.3, 4.4
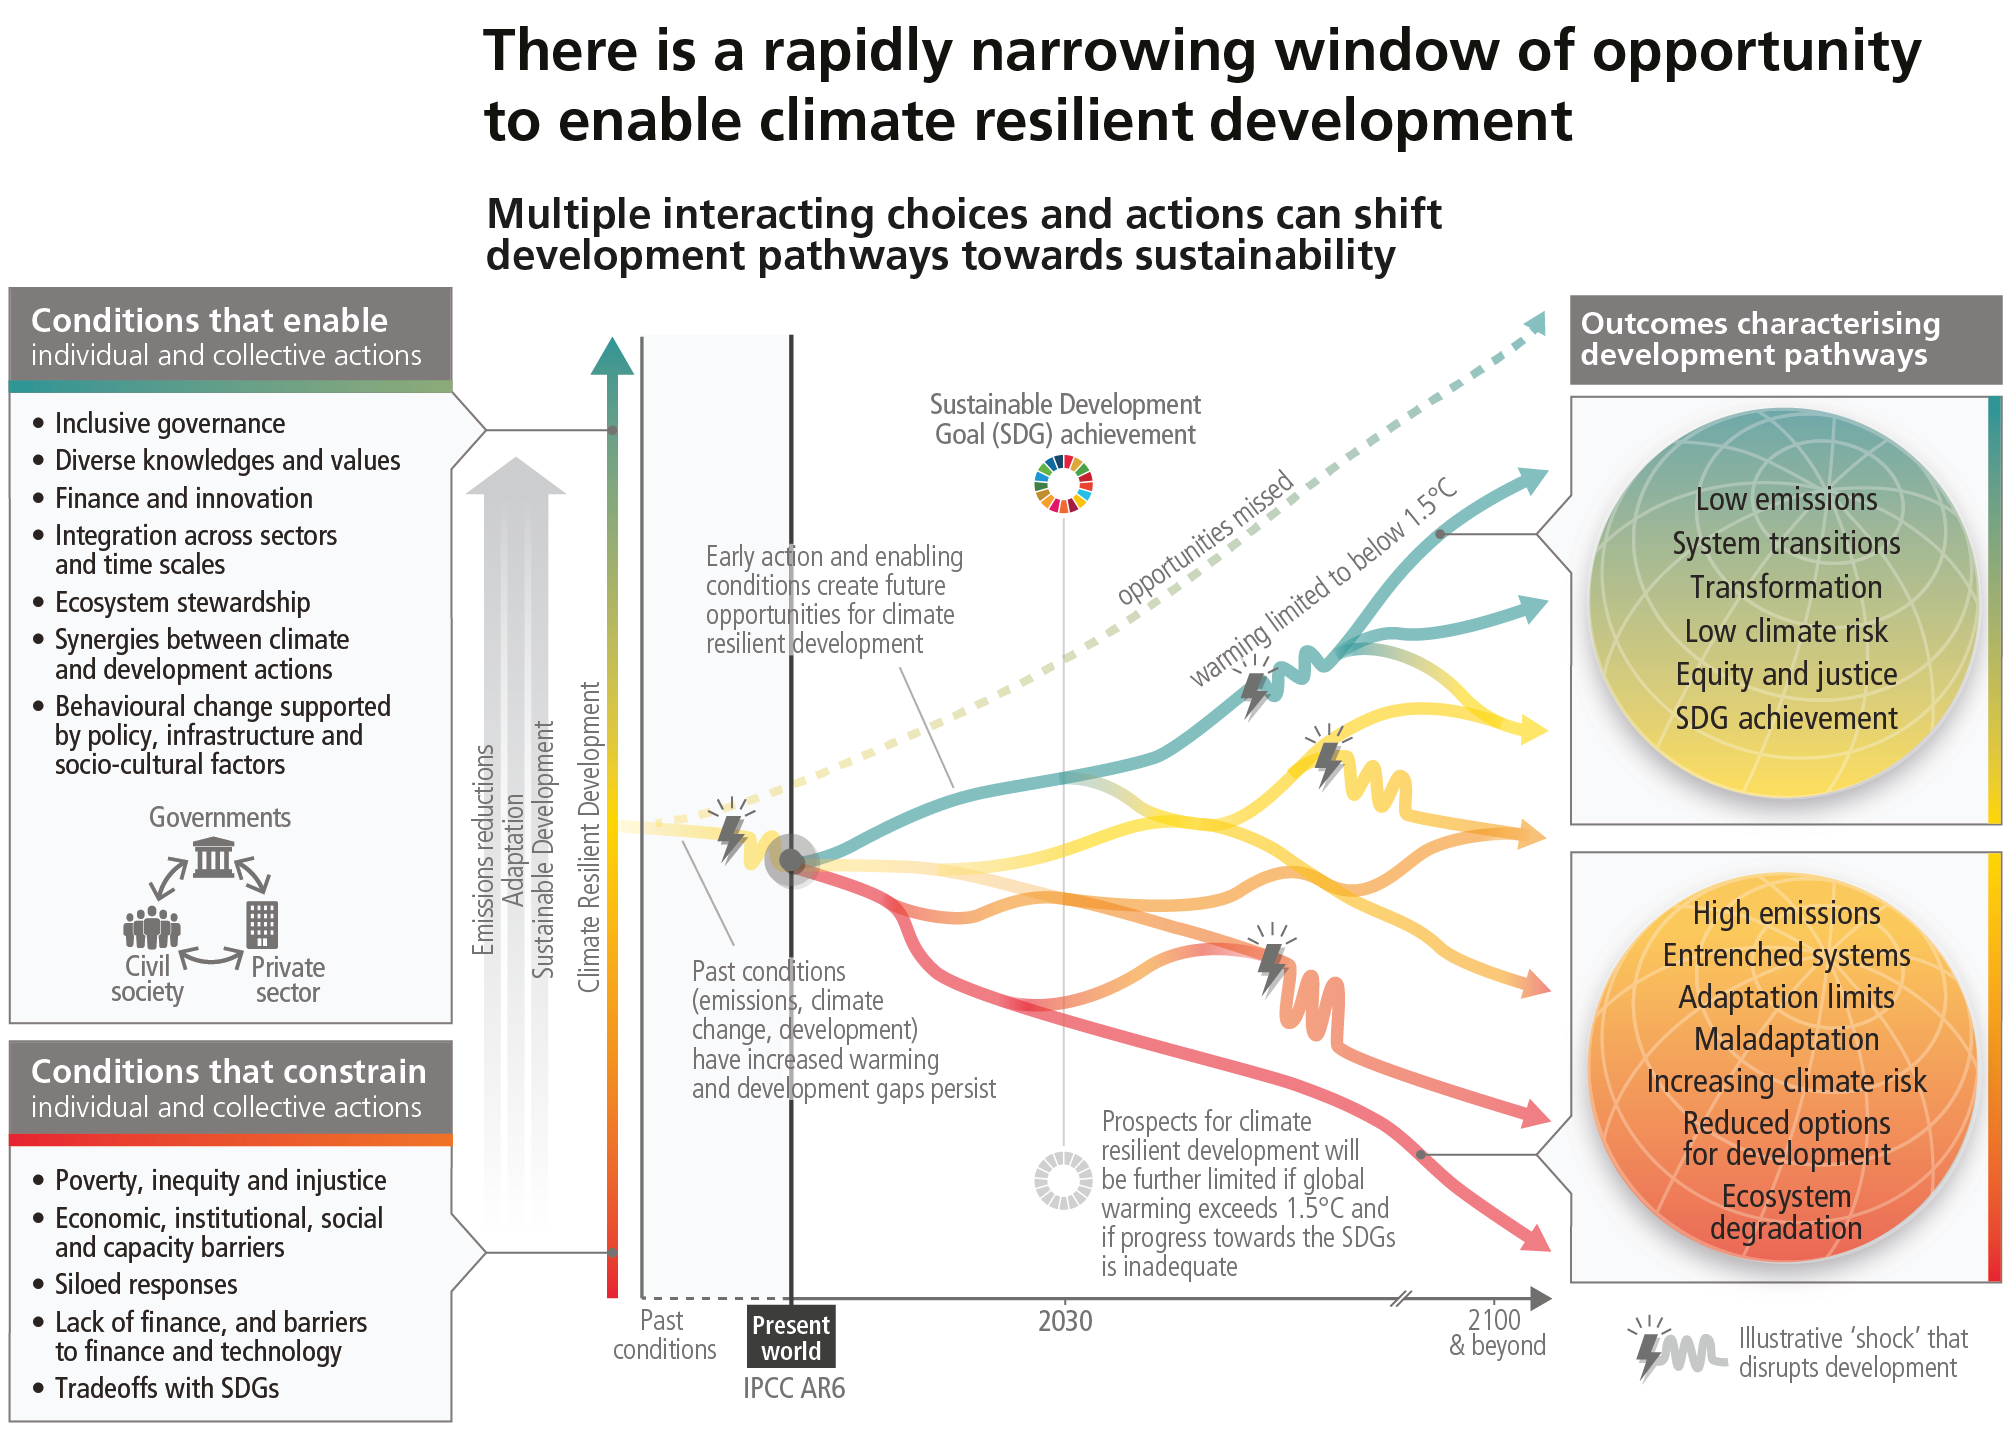
Figure SPM.6: The illustrative development pathways (red to green) and associated outcomes (right panel) show that there is a rapidly narrowing window of opportunity to secure a liveable and sustainable future for all. Climate resilient development is the process of implementing greenhouse gas mitigation and adaptation measures to support sustainable development. Diverging pathways illustrate that interacting choices and actions made by diverse government, private sector and civil society actors can advance climate resilient development, shift pathways towards sustainability, and enable lower emissions and adaptation. Diverse knowledge and values include cultural values, Indigenous Knowledge, local knowledge, and scientific knowledge. Climatic and non-climatic events, such as droughts, floods or pandemics, pose more severe shocks to pathways with lower climate resilient development (red to yellow) than to pathways with higher climate resilient development (green). There are limits to adaptation and adaptive capacity for some human and natural systems at global warming of 1.5°C, and with every increment of warming, losses and damages will increase. The development pathways taken by countries at all stages of economic development impact GHG emissions and mitigation challenges and opportunities, which vary across countries and regions. Pathways and opportunities for action are shaped by previous actions (or inactions and opportunities missed; dashed pathway) and enabling and constraining conditions (left panel), and take place in the context of climate risks, adaptation limits and development gaps. The longer emissions reductions are delayed, the fewer effective adaptation options. Links to longer reportFigure 4.2, 3.1, 3.2, 3.4, 4.2, 4.4, 4.5, 4.6, 4.9
The Benefits of Near-Term Action
C.2 Deep, rapid and sustained mitigation and accelerated implementation of adaptation actions in this decade would reduce projected losses and damages for humans and ecosystems (very high confidence) , and deliver many co-benefits, especially for air quality and health (high confidence) . Delayed mitigation and adaptation action would lock-in high-emissions infrastructure, raise risks of stranded assets and cost-escalation, reduce feasibility, and increase losses and damages (high confidence) . Near-term actions involve high up-front investments and potentially disruptive changes that can be lessened by a range of enabling policies (high confidence) . ExpandLinks to longer report2.1, 2.2, 3.1, 3.2, 3.3, 3.4, 4.1, 4.2, 4.3, 4.4, 4.5, 4.6, 4.7, 4.8
C.2.1 Deep, rapid, and sustained mitigation and accelerated implementation of adaptation actions in this decade would reduce future losses and damages related to climate change for humans and ecosystems (very high confidence). As adaptation options often have long implementation times, accelerated implementation of adaptation in this decade is important to close adaptation gaps (high confidence). Comprehensive, effective, and innovative responses integrating adaptation and mitigation can harness synergies and reduce trade-offs between adaptation and mitigation (high confidence). Links to longer report4.1, 4.2, 4.3
C.2.2 Delayed mitigation action will further increase global warming and losses and damages will rise and additional human and natural systems will reach adaptation limits (high confidence). Challenges from delayed adaptation and mitigation actions include the risk of cost escalation, lock-in of infrastructure, stranded assets, and reduced feasibility and effectiveness of adaptation and mitigation options (high confidence). Without rapid, deep and sustained mitigation and accelerated adaptation actions, losses and damages will continue to increase, including projected adverse impacts in Africa, LDCs, SIDS, Central and South America 49 , Asia and the Arctic, and will disproportionately affect the most vulnerable populations (high confidence). Figure SPM.3 Figure SPM.4Links to longer report2.1.2, 3.1.2, 3.2, 3.3.1, 3.3.3, 4.1, 4.2, 4.3
C.2.3 Accelerated climate action can also provide co-benefits (see also C.4). Many mitigation actions would have benefits for health through lower air pollution, active mobility (e.g., walking, cycling), and shifts to sustainable healthy diets. Strong, rapid and sustained reductions in methane emissions can limit near-term warming and improve air quality by reducing global surface ozone. (high confidence) Adaptation can generate multiple additional benefits such as improving agricultural productivity, innovation, health and wellbeing, food security, livelihood, and biodiversity conservation (very high confidence). Links to longer report4.2, 4.5.4, 4.5.5, 4.6
C.2.4 Cost-benefit analysis remains limited in its ability to represent all avoided damages from climate change (high confidence). The economic benefits for human health from air quality improvement arising from mitigation action can be of the same order of magnitude as mitigation costs, and potentially even larger (medium confidence). Even without accounting for all the benefits of avoiding potential damages the global economic and social benefit of limiting global warming to 2°C exceeds the cost of mitigation in most of the assessed literature (medium confidence) 50 . More rapid climate change mitigation, with emissions peaking earlier, increases co-benefits and reduces feasibility risks and costs in the long-term, but requires higher up-front investments (high confidence). Links to longer report3.4.1, 4.2
C.2.5 Ambitious mitigation pathways imply large and sometimes disruptive changes in existing economic structures, with significant distributional consequences within and between countries. To accelerate climate action, the adverse consequences of these changes can be moderated by fiscal, financial, institutional and regulatory reforms and by integrating climate actions with macroeconomic policies through (i) economy-wide packages, consistent with national circumstances, supporting sustainable low-emission growth paths; (ii) climate resilient safety nets and social protection; and (iii) improved access to finance for low-emissions infrastructure and technologies, especially in developing countries. (high confidence) Links to longer report4.2, 4.4, 4.7, 4.8.1
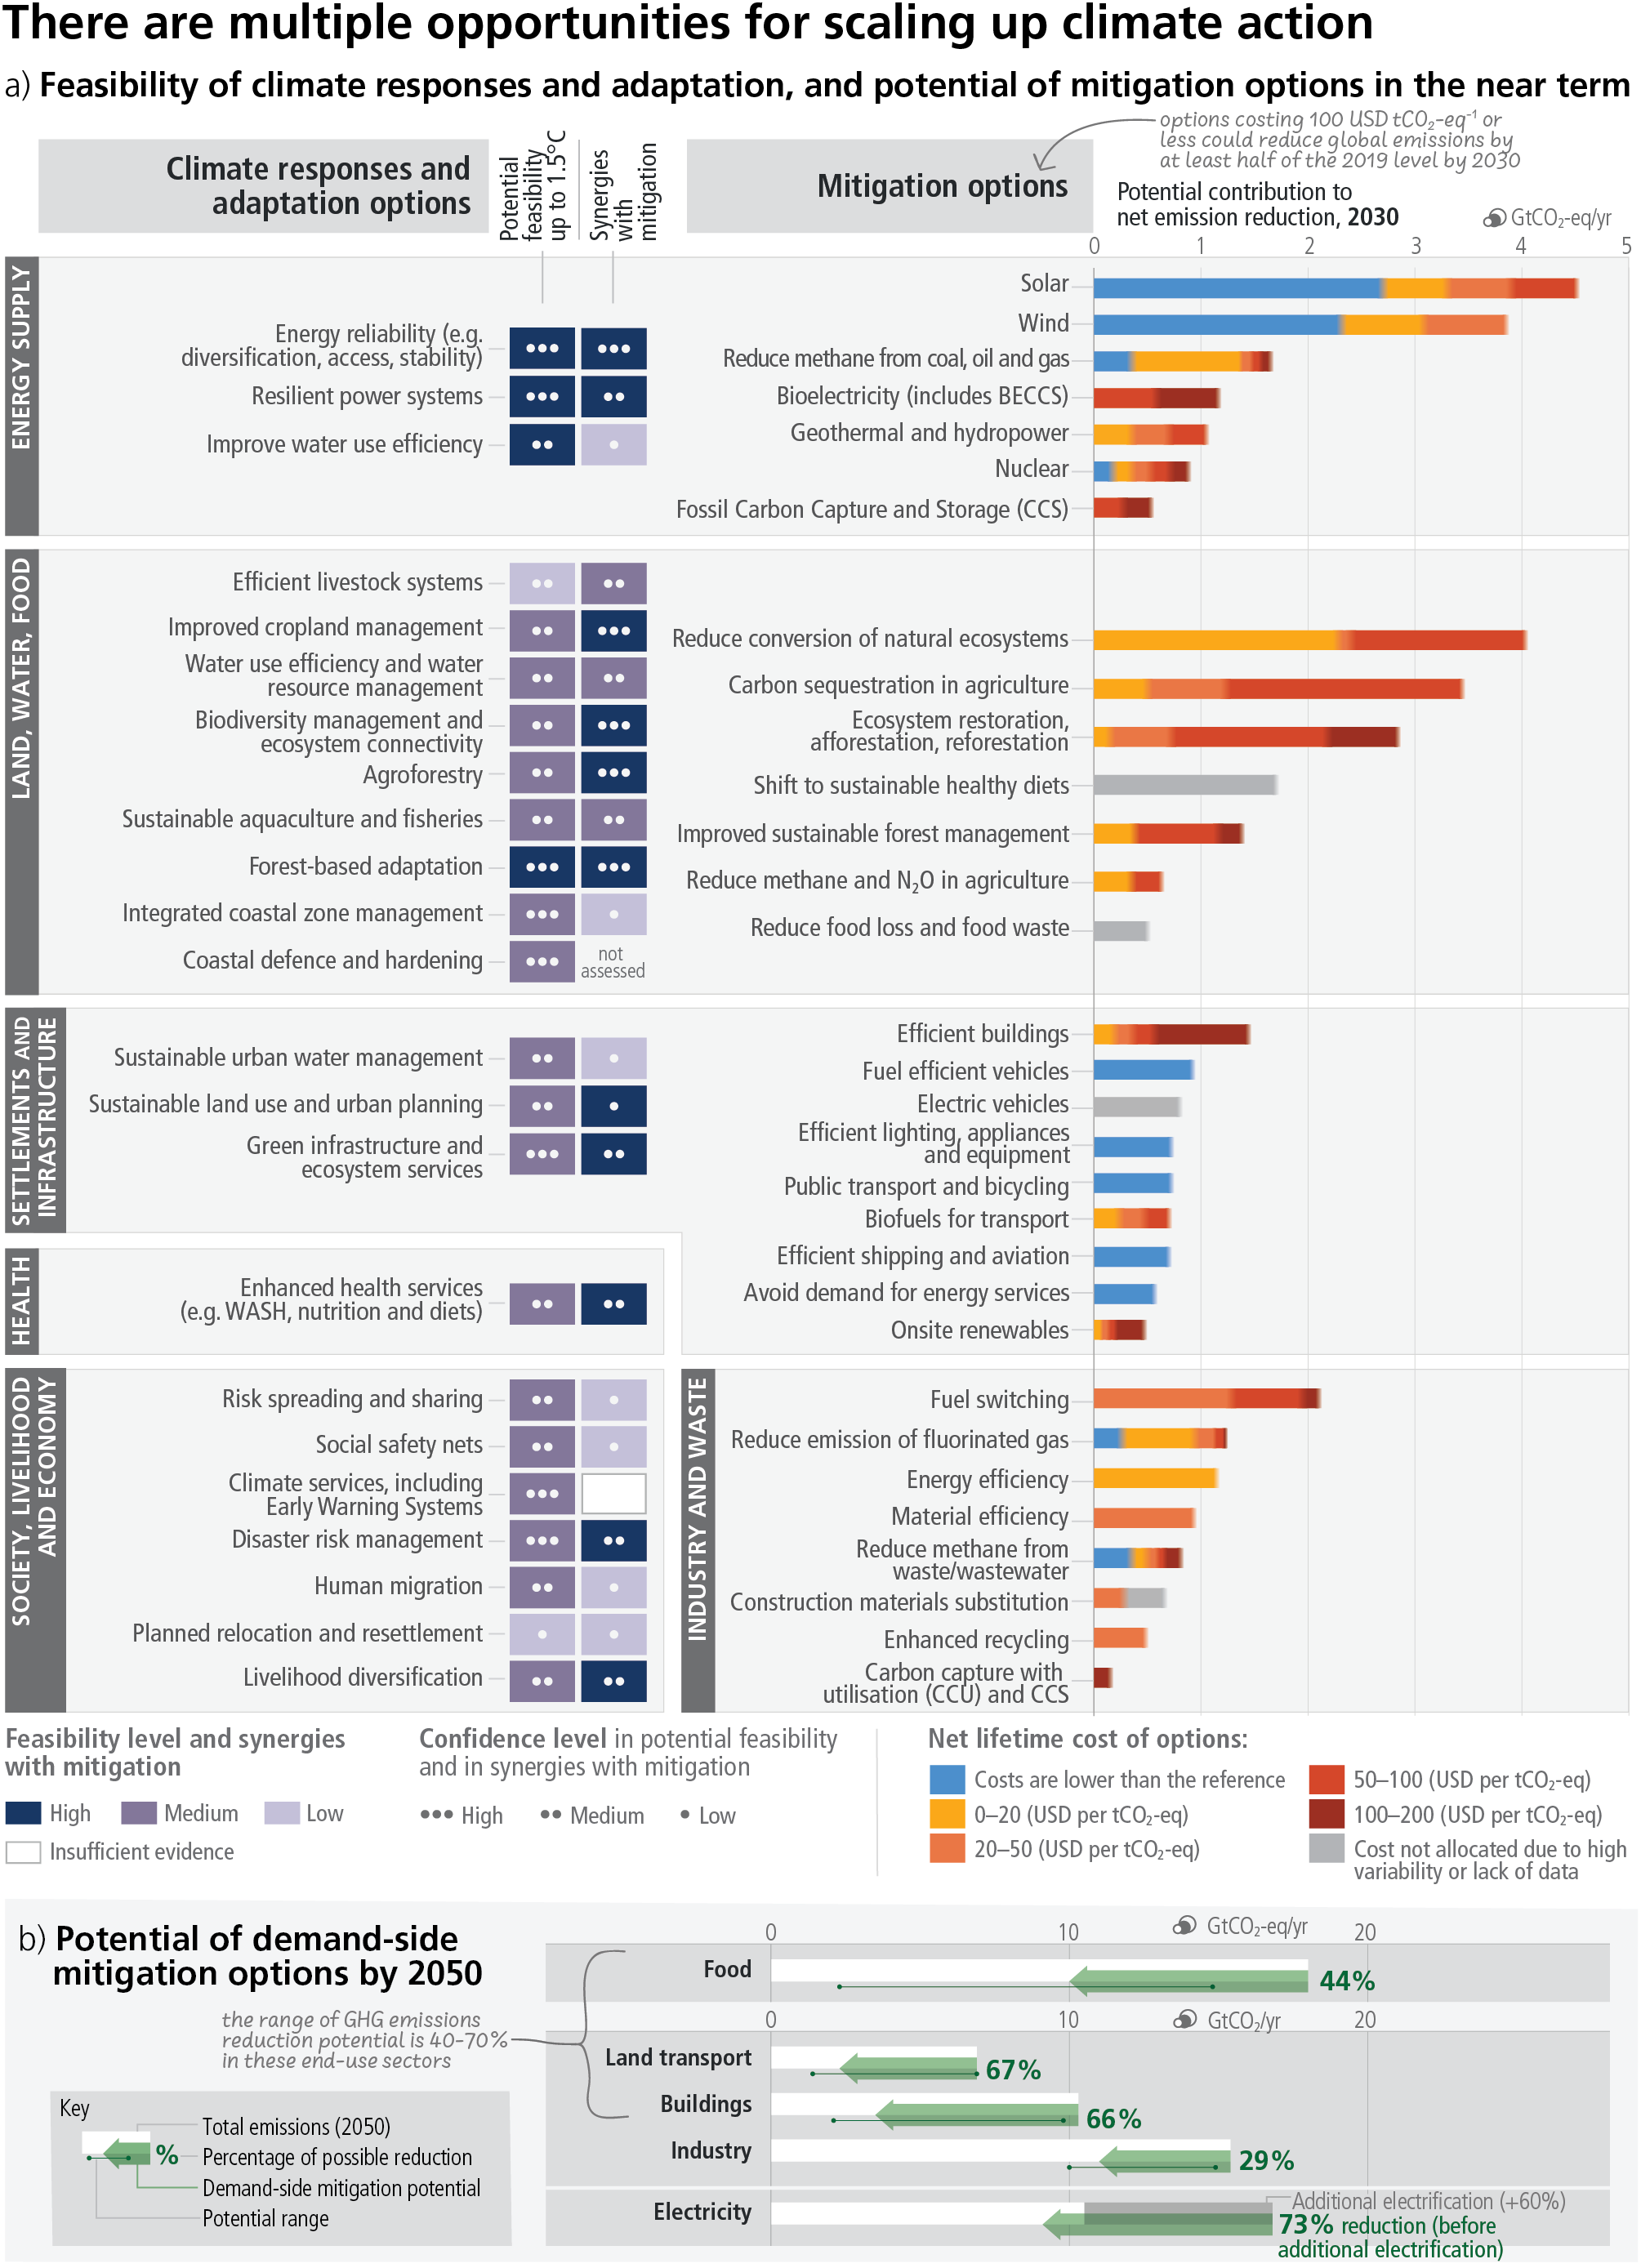
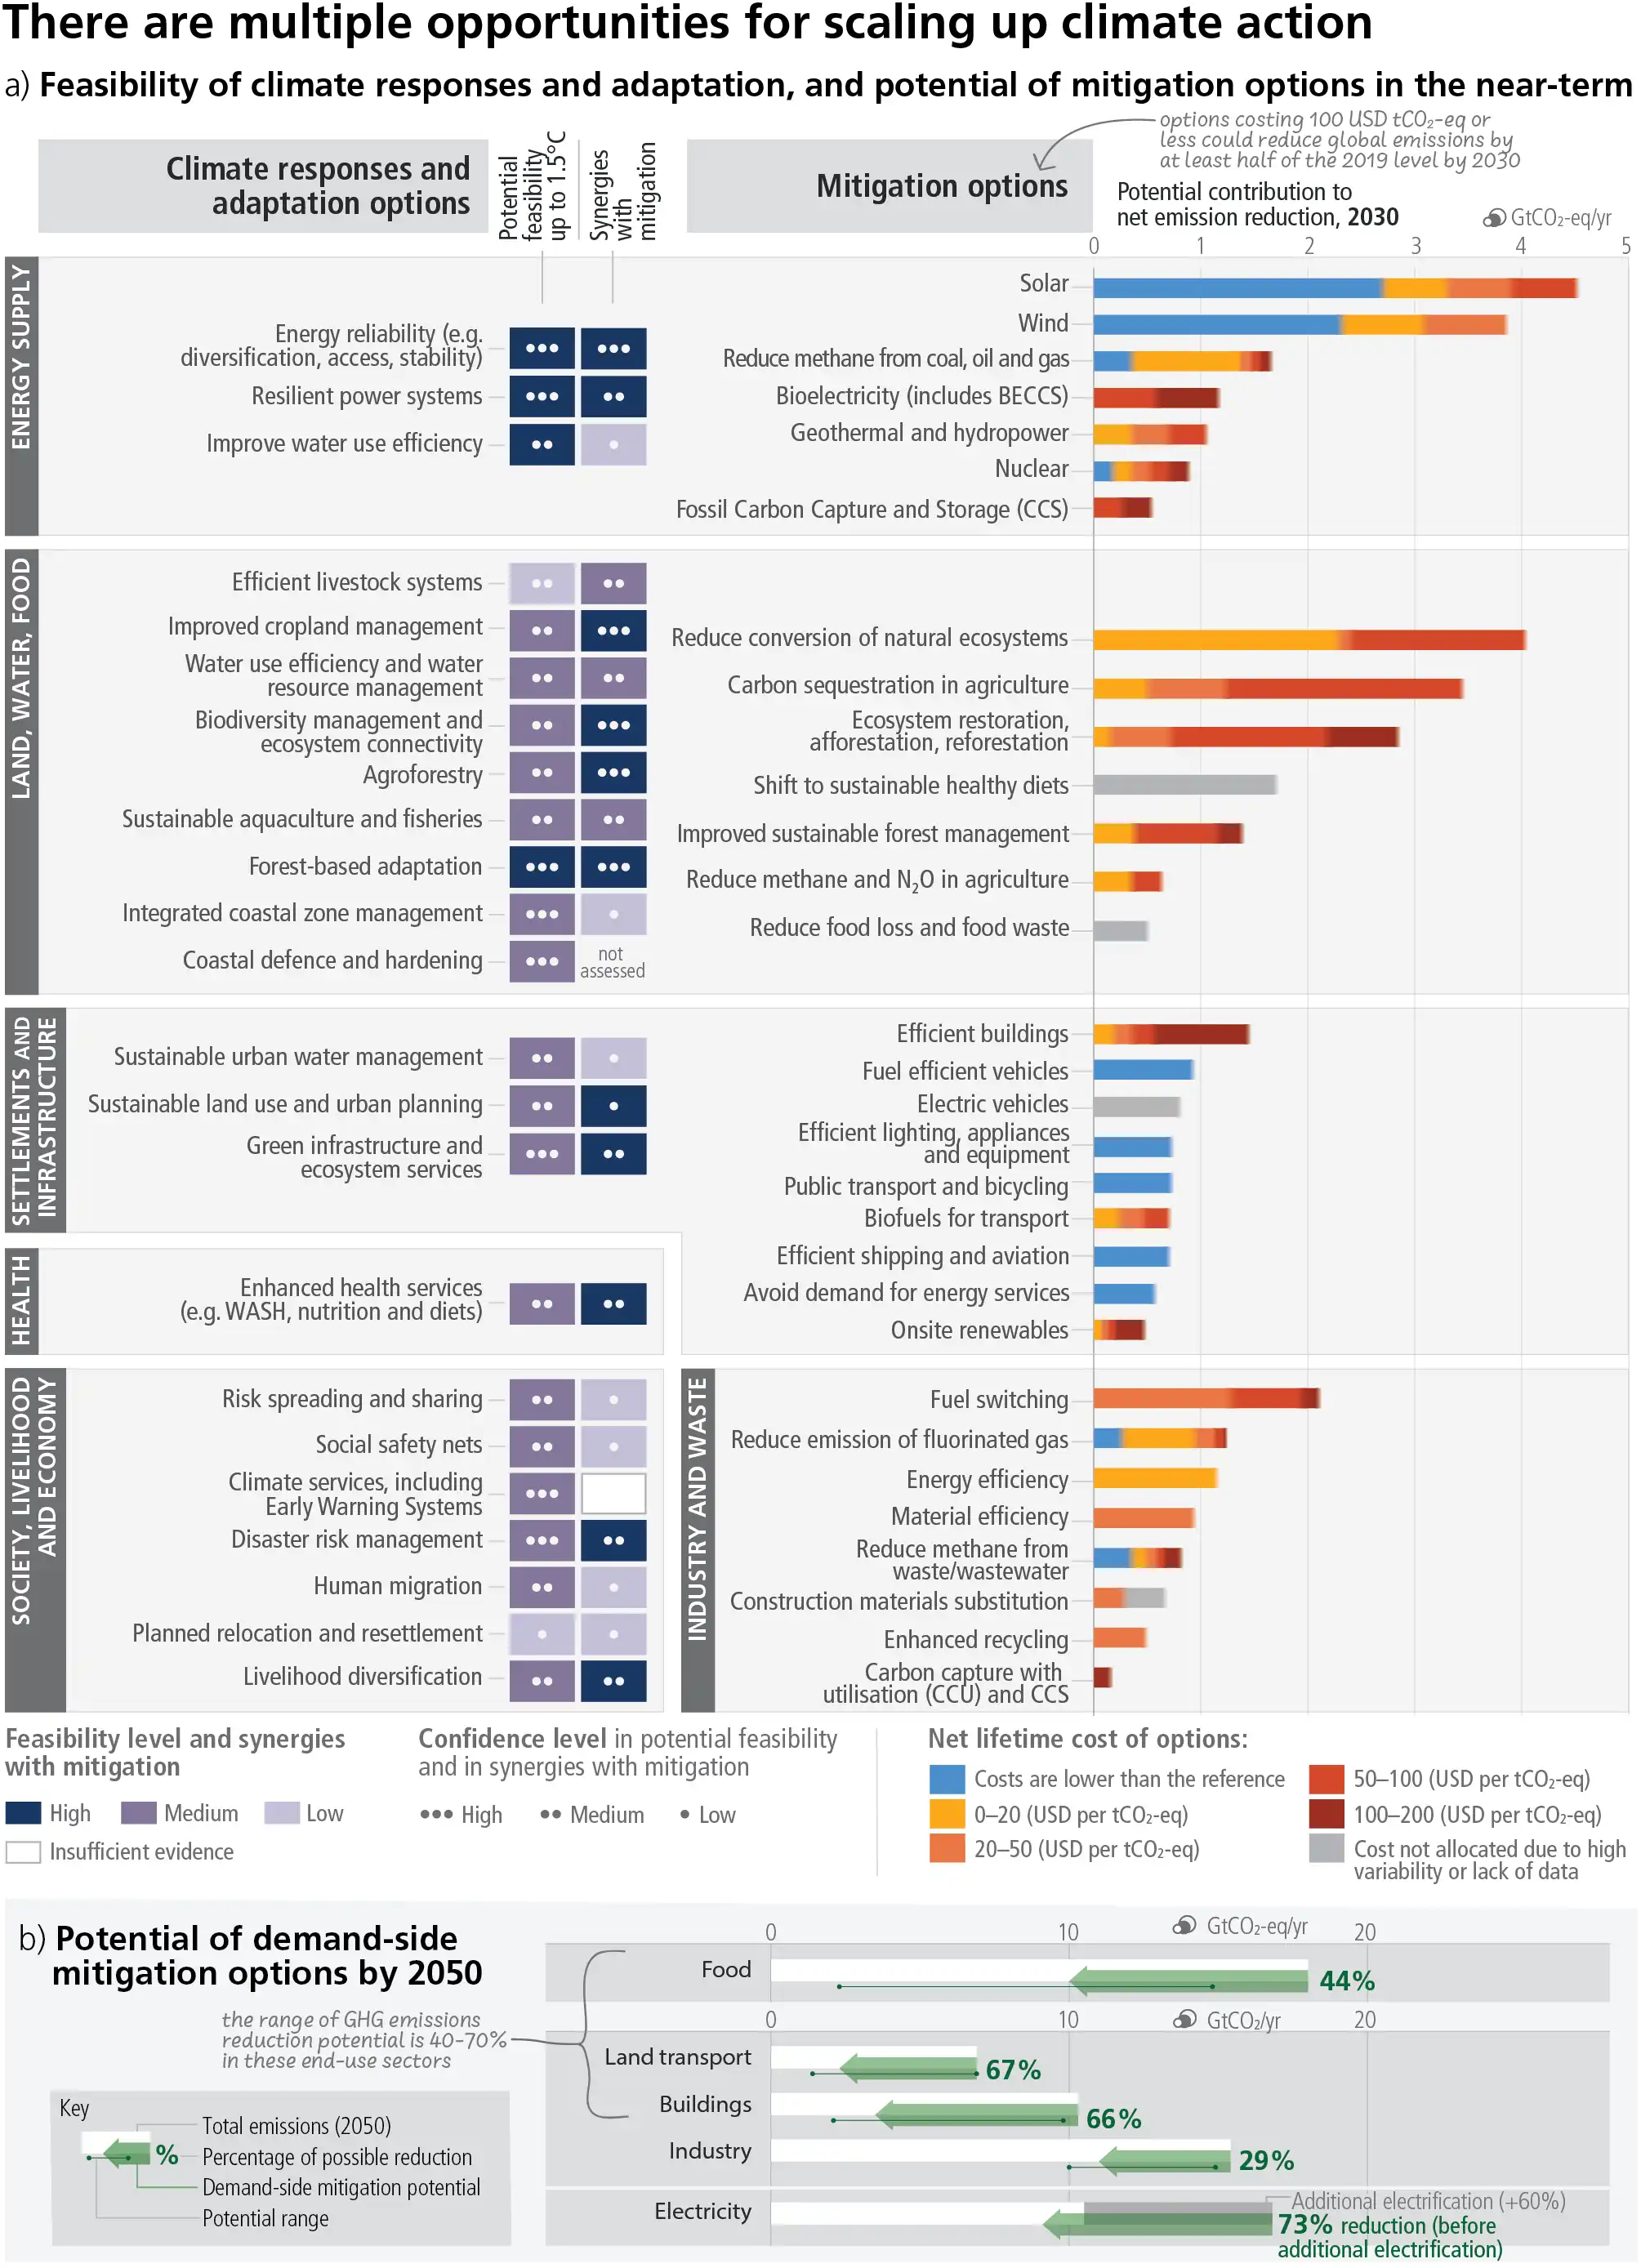
Figure SPM.7: Multiple Opportunities for scaling up climate action. Panel (a) presents selected mitigation and adaptation options across different systems. The left-hand side of panel a shows climate responses and adaptation options assessed for their multidimensional feasibility at global scale, in the near term and up to 1.5°C global warming. As literature above 1.5°C is limited, feasibility at higher levels of warming may change, which is currently not possible to assess robustly. The term response is used here in addition to adaptation because some responses, such as migration, relocation and resettlement may or may not be considered to be adaptation. Forest based adaptation includes sustainable forest management, forest conservation and restoration, reforestation and afforestation. WASH refers to water, sanitation and hygiene. Six feasibility dimensions (economic, technological, institutional, social, environmental and geophysical) were used to calculate the potential feasibility of climate responses and adaptation options, along with their synergies with mitigation. For potential feasibility and feasibility dimensions, the figure shows high, medium, or low feasibility. Synergies with mitigation are identified as high, medium, and low. The right-hand side of Panel a provides an overview of selected mitigation options and their estimated costs and potentials in 2030. Costs are net lifetime discounted monetary costs of avoided GHG emissions calculated relative to a reference technology. Relative potentials and costs will vary by place, context and time and in the longer term compared to 2030. The potential (horizontal axis) is the net GHG emission reduction (sum of reduced emissions and/or enhanced sinks) broken down into cost categories (coloured bar segments) relative to an emission baseline consisting of current policy (around 2019) reference scenarios from the AR6 scenarios database. The potentials are assessed independently for each option and are not additive. Health system mitigation options are included mostly in settlement and infrastructure (e.g., efficient healthcare buildings) and cannot be identified separately. Fuel switching in industry refers to switching to electricity, hydrogen, bioenergy and natural gas. Gradual colour transitions indicate uncertain breakdown into cost categories due to uncertainty or heavy context dependency. The uncertainty in the total potential is typically 25–50%. Panel (b) displays the indicative potential of demand-side mitigation options for 2050. Potentials are estimated based on approximately 500 bottom-up studies representing all global regions. The baseline (white bar) is provided by the sectoral mean GHG emissions in 2050 of the two scenarios (IEA-STEPS and IP_ModAct) consistent with policies announced by national governments until 2020. The green arrow represents the demand-side emissions reductions potentials. The range in potential is shown by a line connecting dots displaying the highest and the lowest potentials reported in the literature. Food shows demand-side potential of socio-cultural factors and infrastructure use, and changes in land-use patterns enabled by change in food demand. Demand-side measures and new ways of end-use service provision can reduce global GHG emissions in end-use sectors (buildings, land transport, food) by 40–70% by 2050 compared to baseline scenarios, while some regions and socioeconomic groups require additional energy and resources. The last row shows how demand-side mitigation options in other sectors can influence overall electricity demand. The dark grey bar shows the projected increase in electricity demand above the 2050 baseline due to increasing electrification in the other sectors. Based on a bottom-up assessment, this projected increase in electricity demand can be avoided through demand-side mitigation options in the domains of infrastructure use and socio-cultural factors that influence electricity usage in industry, land transport, and buildings (green arrow). Links to longer reportFigure 4.4
Mitigation and Adaptation Options across Systems
C.3 Rapid and far-reaching transitions across all sectors and systems are necessary to achieve deep and sustained emissions reductions and secure a liveable and sustainable future for all. These system transitions involve a significant upscaling of a wide portfolio of mitigation and adaptation options. Feasible, effective, and low-cost options for mitigation and adaptation are already available, with differences across systems and regions. (high confidence) Figure SPM.7 ExpandLinks to longer report4.1, 4.5, 4.6
C.3.1 The systemic change required to achieve rapid and deep emissions reductions and transformative adaptation to climate change is unprecedented in terms of scale, but not necessarily in terms of speed (medium confidence). Systems transitions include: deployment of low- or zero-emission technologies; reducing and changing demand through infrastructure design and access, socio-cultural and behavioural changes, and increased technological efficiency and adoption; social protection, climate services or other services; and protecting and restoring ecosystems (high confidence). Feasible, effective, and low-cost options for mitigation and adaptation are already available (high confidence). The availability, feasibility and potential of mitigation and adaptation options in the near-term differs across systems and regions (very high confidence). Figure SPM.7 Links to longer report4.1, 4.5.1 to 4.5.6
Energy Systems
C.3.2 Net zero CO2 energy systems entail: a substantial reduction in overall fossil fuel use, minimal use of unabated fossil fuels 51 , and use of carbon capture and storage in the remaining fossil fuel systems; electricity systems that emit no net CO2; widespread electrification; alternative energy carriers in applications less amenable to electrification; energy conservation and efficiency; and greater integration across the energy system (high confidence). Large contributions to emissions reductions with costs less than USD 20 tCO2-eq -1 come from solar and wind energy, energy efficiency improvements, and methane emissions reductions (coal mining, oil and gas, waste) (medium confidence). There are feasible adaptation options that support infrastructure resilience, reliable power systems and efficient water use for existing and new energy generation systems (very high confidence). Energy generation diversification (e.g., via wind, solar, small scale hydropower) and demand-side management (e.g., storage and energy efficiency improvements) can increase energy reliability and reduce vulnerabilities to climate change (high confidence). Climate responsive energy markets, updated design standards on energy assets according to current and projected climate change, smart-grid technologies, robust transmission systems and improved capacity to respond to supply deficits have high feasibility in the medium- to long-term, with mitigation co-benefits (very high confidence). Figure SPM.7 Links to longer report4.5.1
Industry and Transport
C.3.3 Reducing industry GHG emissions entails coordinated action throughout value chains to promote all mitigation options, including demand management, energy and materials efficiency, circular material flows, as well as abatement technologies and transformational changes in production processes (high confidence). In transport, sustainable biofuels, low-emissions hydrogen, and derivatives (including ammonia and synthetic fuels) can support mitigation of CO2 emissions from shipping, aviation, and heavy-duty land transport but require production process improvements and cost reductions (medium confidence). Sustainable biofuels can offer additional mitigation benefits in land-based transport in the short and medium term (medium confidence). Electric vehicles powered by low-GHG emissions electricity have large potential to reduce land-based transport GHG emissions, on a life cycle basis (high confidence). Advances in battery technologies could facilitate the electrification of heavy-duty trucks and compliment conventional electric rail systems (medium confidence). The environmental footprint of battery production and growing concerns about critical minerals can be addressed by material and supply diversification strategies, energy and material efficiency improvements, and circular material flows (medium confidence). Figure SPM.7 Links to longer report4.5.2, 4.5.3
Cities, Settlements and Infrastructure
C.3.4 Urban systems are critical for achieving deep emissions reductions and advancing climate resilient development (high confidence). Key adaptation and mitigation elements in cities include considering climate change impacts and risks (e.g., through climate services) in the design and planning of settlements and infrastructure; land use planning to achieve compact urban form, co-location of jobs and housing; supporting public transport and active mobility (e.g., walking and cycling); the efficient design, construction, retrofit, and use of buildings; reducing and changing energy and material consumption; sufficiency 52 ; material substitution; and electrification in combination with low emissions sources (high confidence). Urban transitions that offer benefits for mitigation, adaptation, human health and well-being, ecosystem services, and vulnerability reduction for low-income communities are fostered by inclusive long-term planning that takes an integrated approach to physical, natural and social infrastructure (high confidence). Green/natural and blue infrastructure supports carbon uptake and storage and either singly or when combined with grey infrastructure can reduce energy use and risk from extreme events such as heatwaves, flooding, heavy precipitation and droughts, while generating co-benefits for health, well-being and livelihoods (medium confidence). Links to longer report4.5.3
Land, Ocean, Food, and Water
C.3.5 Many agriculture, forestry, and other land use (AFOLU) options provide adaptation and mitigation benefits that could be upscaled in the near-term across most regions. Conservation, improved management, and restoration of forests and other ecosystems offer the largest share of economic mitigation potential, with reduced deforestation in tropical regions having the highest total mitigation potential. Ecosystem restoration, reforestation, and afforestation can lead to trade-offs due to competing demands on land. Minimizing trade-offs requires integrated approaches to meet multiple objectives including food security. Demand-side measures (shifting to sustainable healthy diets 53 and reducing food loss/waste) and sustainable agricultural intensification can reduce ecosystem conversion, and methane and nitrous oxide emissions, and free up land for reforestation and ecosystem restoration. Sustainably sourced agricultural and forest products, including long-lived wood products, can be used instead of more GHG-intensive products in other sectors. Effective adaptation options include cultivar improvements, agroforestry, community-based adaptation, farm and landscape diversification, and urban agriculture. These AFOLU response options require integration of biophysical, socioeconomic and other enabling factors. Some options, such as conservation of high-carbon ecosystems (e.g., peatlands, wetlands, rangelands, mangroves and forests), deliver immediate benefits, while others, such as restoration of high-carbon ecosystems, take decades to deliver measurable results. Figure SPM.7 Links to longer report4.5.4
C.3.6 Maintaining the resilience of biodiversity and ecosystem services at a global scale depends on effective and equitable conservation of approximately 30% to 50% of Earth’s land, freshwater and ocean areas, including currently near-natural ecosystems (high confidence). Conservation, protection and restoration of terrestrial, freshwater, coastal and ocean ecosystems, together with targeted management to adapt to unavoidable impacts of climate change reduces the vulnerability of biodiversity and ecosystem services to climate change (high confidence), reduces coastal erosion and flooding (high confidence), and could increase carbon uptake and storage if global warming is limited (medium confidence). Rebuilding overexploited or depleted fisheries reduces negative climate change impacts on fisheries (medium confidence) and supports food security, biodiversity, human health and well-being (high confidence). Land restoration contributes to climate change mitigation and adaptation with synergies via enhanced ecosystem services and with economically positive returns and co-benefits for poverty reduction and improved livelihoods (high confidence). Cooperation, and inclusive decision making, with Indigenous Peoples and local communities, as well as recognition of inherent rights of Indigenous Peoples, is integral to successful adaptation and mitigation across forests and other ecosystems (high confidence). Figure SPM.7Links to longer report4.5.4, 4.6
Health and Nutrition
C.3.7 Human health will benefit from integrated mitigation and adaptation options that mainstream health into food, infrastructure, social protection, and water policies (very high confidence). Effective adaptation options exist to help protect human health and wellbeing, including: strengthening public health programs related to climate-sensitive diseases, increasing health systems resilience, improving ecosystem health, improving access to potable water, reducing exposure of water and sanitation systems to flooding, improving surveillance and early warning systems, vaccine development (very high confidence), improving access to mental healthcare, and Heat Health Action Plans that include early warning and response systems (high confidence). Adaptation strategies which reduce food loss and waste or support balanced, sustainable healthy diets contribute to nutrition, health, biodiversity and other environmental benefits (high confidence). Figure SPM.7Links to longer report4.5.5
Society, Livelihoods, and Economies
C.3.8 Policy mixes that include weather and health insurance, social protection and adaptive social safety nets, contingent finance and reserve funds, and universal access to early warning systems combined with effective contingency plans, can reduce vulnerability and exposure of human systems. Disaster risk management, early warning systems, climate services and risk spreading and sharing approaches have broad applicability across sectors. Increasing education including capacity building, climate literacy, and information provided through climate services and community approaches can facilitate heightened risk perception and accelerate behavioural changes and planning. (high confidence) Links to longer report4.5.6
Synergies and Trade-Offs with Sustainable Development
C.4 Accelerated and equitable action in mitigating and adapting to climate change impacts is critical to sustainable development. Mitigation and adaptation actions have more synergies than trade-offs with Sustainable Development Goals. Synergies and trade-offs depend on context and scale of implementation. (high confidence) ExpandLinks to longer report3.4, 4.2, 4.4, 4.5, 4.6, 4.9, Figure 4.5
C.4.1 Mitigation efforts embedded within the wider development context can increase the pace, depth and breadth of emission reductions (medium confidence). Countries at all stages of economic development seek to improve the well-being of people, and their development priorities reflect different starting points and contexts. Different contexts include but are not limited to social, economic, environmental, cultural, political circumstances, resource endowment, capabilities, international environment, and prior development (high confidence). In regions with high dependency on fossil fuels for, among other things, revenue and employment generation, mitigating risk for sustainable development requires policies that promote economic and energy sector diversification and considerations of just transitions principles, processes and practices (high confidence). Eradicating extreme poverty, energy poverty, and providing decent living standards in low-emitting countries / regions in the context of achieving sustainable development objectives, in the near term, can be achieved without significant global emissions growth (high confidence). Links to longer report4.4, 4.6, Annex I: Glossary
C.4.2 Many mitigation and adaptation actions have multiple synergies with Sustainable Development Goals (SDGs) and sustainable development generally, but some actions can also have trade-offs. Potential synergies with SDGs exceed potential trade-offs; synergies and trade-offs depend on the pace and magnitude of change and the development context including inequalities with consideration of climate justice. Trade-offs can be evaluated and minimised by giving emphasis to capacity building, finance, governance, technology transfer, investments, development, context specific gender-based and other social equity considerations with meaningful participation of Indigenous Peoples, local communities and vulnerable populations. (high confidence) Links to longer report3.4.1, 4.6, Figure 4.5, 4.9
C.4.3 Implementing both mitigation and adaptation actions together and taking trade-offs into account supports co-benefits and synergies for human health and well-being. For example, improved access to clean energy sources and technologies generates health benefits especially for women and children; electrification combined with low-GHG energy, and shifts to active mobility and public transport can enhance air quality, health, employment, and can elicit energy security and deliver equity. (high confidence) Links to longer report4.2, 4.5.3, 4.5.5, 4.6, 4.9
C.5 Prioritising equity, climate justice, social justice, inclusion and just transition processes can enable adaptation and ambitious mitigation actions and climate resilient development. Adaptation outcomes are enhanced by increased support to regions and people with the highest vulnerability to climatic hazards. Integrating climate adaptation into social protection programs improves resilience. Many options are available for reducing emission-intensive consumption, including through behavioural and lifestyle changes, with co-benefits for societal well-being. (high confidence) ExpandLinks to longer report4.4, 4.5
C.5.1 Equity remains a central element in the UN climate regime, notwithstanding shifts in differentiation between states over time and challenges in assessing fair shares. Ambitious mitigation pathways imply large and sometimes disruptive changes in economic structure, with significant distributional consequences, within and between countries. Distributional consequences within and between countries include shifting of income and employment during the transition from high- to low-emissions activities. (high confidence) Links to longer report4.4
C.5.2 Adaptation and mitigation actions, that prioritise equity, social justice, climate justice, rights-based approaches, and inclusivity, lead to more sustainable outcomes, reduce trade-offs, support transformative change and advance climate resilient development. Redistributive policies across sectors and regions that shield the poor and vulnerable, social safety nets, equity, inclusion and just transitions, at all scales can enable deeper societal ambitions and resolve trade-offs with sustainable development goals. Attention to equity and broad and meaningful participation of all relevant actors in decision making at all scales can build social trust which builds on equitable sharing of benefits and burdens of mitigation that deepen and widen support for transformative changes. (high confidence) Links to longer report4.4
C.5.3 Regions and people (3.3 to 3.6 billion in number) with considerable development constraints have high vulnerability to climatic hazards (see A.2.2). Adaptation outcomes for the most vulnerable within and across countries and regions are enhanced through approaches focusing on equity, inclusivity and rights-based approaches. Vulnerability is exacerbated by inequity and marginalisation linked to e.g., gender, ethnicity, low incomes, informal settlements, disability, age, and historical and ongoing patterns of inequity such as colonialism, especially for many Indigenous Peoples and local communities. Integrating climate adaptation into social protection programs, including cash transfers and public works programs, is highly feasible and increases resilience to climate change, especially when supported by basic services and infrastructure. The greatest gains in well-being in urban areas can be achieved by prioritising access to finance to reduce climate risk for low-income and marginalised communities including people living in informal settlements. (high confidence)Links to longer report4.4, 4.5.3, 4.5.5, 4.5.6
C.5.4 The design of regulatory instruments and economic instruments and consumption-based approaches, can advance equity. Individuals with high socio-economic status contribute disproportionately to emissions, and have the highest potential for emissions reductions. Many options are available for reducing emission-intensive consumption while improving societal well-being. Socio-cultural options, behaviour and lifestyle changes supported by policies, infrastructure, and technology can help end-users shift to low-emissions-intensive consumption, with multiple co-benefits. A substantial share of the population in low-emitting countries lack access to modern energy services. Technology development, transfer, capacity building and financing can support developing countries/ regions leapfrogging or transitioning to low-emissions transport systems thereby providing multiple co-benefits. Climate resilient development is advanced when actors work in equitable, just and inclusive ways to reconcile divergent interests, values and worldviews, toward equitable and just outcomes. (high confidence) Links to longer report2.1, 4.4
Governance and Policies
C.6 Effective climate action is enabled by political commitment, well-aligned multilevel governance, institutional frameworks, laws, policies and strategies and enhanced access to finance and technology. Clear goals, coordination across multiple policy domains, and inclusive governance processes facilitate effective climate action. Regulatory and economic instruments can support deep emissions reductions and climate resilience if scaled up and applied widely. Climate resilient development benefits from drawing on diverse knowledge. (high confidence)ExpandLinks to longer report2.2, 4.4, 4.5, 4.7
C.6.1 Effective climate governance enables mitigation and adaptation. Effective governance provides overall direction on setting targets and priorities and mainstreaming climate action across policy domains and levels, based on national circumstances and in the context of international cooperation. It enhances monitoring and evaluation and regulatory certainty, prioritising inclusive, transparent and equitable decision-making, and improves access to finance and technology (see C.7). (high confidence) Links to longer report2.2.2, 4.7
C.6.2 Effective local, municipal, national and subnational institutions build consensus for climate action among diverse interests, enable coordination and inform strategy setting but require adequate institutional capacity. Policy support is influenced by actors in civil society, including businesses, youth, women, labour, media, Indigenous Peoples, and local communities. Effectiveness is enhanced by political commitment and partnerships between different groups in society. (high confidence) Links to longer report2.2, 4.7
C.6.3 Effective multilevel govence for mitigation, adaptation, risk management, and climate resilient development is enabled by inclusive decision processes that prioritise equity and justice in planning and implementation, allocation of appropriate resources, institutional review, and monitoring and evaluation. Vulnerabilities and climate risks are often reduced through carefully designed and implemented laws, policies, participatory processes, and interventions that address context specific inequities such as those based on gender, ethnicity, disability, age, location and income. (high confidence) Links to longer report4.4, 4.7
C.6.4 Regulatory and economic instruments could support deep emissions reductions if scaled up and applied more widely (high confidence). Scaling up and enhancing the use of regulatory instruments can improve mitigation outcomes in sectoral applications, consistent with national circumstances (high confidence). Where implemented, carbon pricing instruments have incentivized low-cost emissions reduction measures but have been less effective, on their own and at prevailing prices during the assessment period, to promote higher-cost measures necessary for further reductions (medium confidence). Equity and distributional impacts of such carbon pricing instruments, e.g., carbon taxes and emissions trading, can be addressed by using revenue to support low-income households, among other approaches. Removing fossil fuel subsidies would reduce emissions 54 and yield benefits such as improved public revenue, macroeconomic and sustainability performance; subsidy removal can have adverse distributional impacts, especially on the most economically vulnerable groups which, in some cases can be mitigated by measures such as redistributing revenue saved, all of which depend on national circumstances (high confidence). Economy-wide policy packages, such as public spending commitments, pricing reforms, can meet short-term economic goals while reducing emissions and shifting development pathways towards sustainability (medium confidence). Effective policy packages would be comprehensive, consistent, balanced across objectives, and tailored to national circumstances (high confidence). Links to longer report2.2.2, 4.7
C.6.5 Drawing on diverse knowledges and cultural values, meaningful participation and inclusive engagement processes—including Indigenous Knowledge, local knowledge, and scientific knowledge—facilitates climate resilient development, builds capacity and allows locally appropriate and socially acceptable solutions. (high confidence) Links to longer report4.4, 4.5.6, 4.7
Finance, Technology and International Cooperation
C.7 Finance, technology and international cooperation are critical enablers for accelerated climate action. If climate goals are to be achieved, both adaptation and mitigation financing would need to increase many-fold. There is sufficient global capital to close the global investment gaps but there are barriers to redirect capital to climate action. Enhancing technology innovation systems is key to accelerate the widespread adoption of technologies and practices. Enhancing international cooperation is possible through multiple channels. (high confidence) ExpandLinks to longer report2.3, 4.8
C.7.1 Improved availability of and access to finance 55 would enable accelerated climate action (very high confidence). Addressing needs and gaps and broadening equitable access to domestic and international finance, when combined with other supportive actions, can act as a catalyst for accelerating adaptation and mitigation, and enabling climate resilient development (high confidence). If climate goals are to be achieved, and to address rising risks and accelerate investments in emissions reductions, both adaptation and mitigation finance would need to increase many-fold (high confidence). Links to longer report4.8.1
C.7.2 Increased access to finance can build capacity and address soft limits to adaptation and avert rising risks, especially for developing countries, vulnerable groups, regions and sectors (high confidence). Public finance is an important enabler of adaptation and mitigation, and can also leverage private finance (high confidence). Average annual modelled mitigation investment requirements for 2020 to 2030 in scenarios that limit warming to 2°C or 1.5°C are a factor of three to six greater than current levels 56 , and total mitigation investments (public, private, domestic and international) would need to increase across all sectors and regions (medium confidence). Even if extensive global mitigation efforts are implemented, there will be a need for financial, technical, and human resources for adaptation (high confidence). Links to longer report4.3, 4.8.1
C.7.3 There is sufficient global capital and liquidity to close global investment gaps, given the size of the global financial system, but there are barriers to redirect capital to climate action both within and outside the global financial sector and in the context of economic vulnerabilities and indebtedness facing developing countries. Reducing financing barriers for scaling up financial flows would require clear signalling and support by governments, including a stronger alignment of public finances in order to lower real and perceived regulatory, cost and market barriers and risks and improving the risk-return profile of investments. At the same time, depending on national contexts, financial actors, including investors, financial intermediaries, central banks and financial regulators can shift the systemic underpricing of climate-related risks, and reduce sectoral and regional mismatches between available capital and investment needs. (high confidence)Links to longer report4.8.1
C.7.4 Tracked financial flows fall short of the levels needed for adaptation and to achieve mitigation goals across all sectors and regions. These gaps create many opportunities and the challenge of closing gaps is largest in developing countries. Accelerated financial support for developing countries from developed countries and other sources is a critical enabler to enhance adaptation and mitigation actions and address inequities in access to finance, including its costs, terms and conditions, and economic vulnerability to climate change for developing countries. Scaled-up public grants for mitigation and adaptation funding for vulnerable regions, especially in Sub-Saharan Africa, would be cost-effective and have high social returns in terms of access to basic energy. Options for scaling up mitigation in developing countries include: increased levels of public finance and publicly mobilised private finance flows from developed to developing countries in the context of the USD 100 billion-a-year goal; increased use of public guarantees to reduce risks and leverage private flows at lower cost; local capital markets development; and building greater trust in international cooperation processes. A coordinated effort to make the post-pandemic recovery sustainable over the longer-term can accelerate climate action, including in developing regions and countries facing high debt costs, debt distress and macroeconomic uncertainty. (high confidence) Links to longer report4.8.1
C.7.5 Enhancing technology innovation systems can provide opportunities to lower emissions growth, create social and environmental co-benefits, and achieve other SDGs. Policy packages tailored to national contexts and technological characteristics have been effective in supporting low-emission innovation and technology diffusion. Public policies can support training and R&D, complemented by both regulatory and market-based instruments that create incentives and market opportunities. Technological innovation can have trade-offs such as new and greater environmental impacts, social inequalities, overdependence on foreign knowledge and providers, distributional impacts and rebound effects 57 , requiring appropriate governance and policies to enhance potential and reduce trade-offs. Innovation and adoption of low-emission technologies lags in most developing countries, particularly least developed ones, due in part to weaker enabling conditions, including limited finance, technology development and transfer, and capacity building. (high confidence) Links to longer report4.8.3
C.7.6 International cooperation is a critical enabler for achieving ambitious climate change mitigation, adaptation, and climate resilient development (high confidence). Climate resilient development is enabled by increased international cooperation including mobilising and enhancing access to finance, particularly for developing countries, vulnerable regions, sectors and groups and aligning finance flows for climate action to be consistent with ambition levels and funding needs (high confidence). Enhancing international cooperation on finance, technology and capacity building can enable greater ambition and can act as a catalyst for accelerating mitigation and adaptation, and shifting development pathways towards sustainability (high confidence). This includes support to NDCs and accelerating technology development and deployment (high confidence). Transnational partnerships can stimulate policy development, technology diffusion, adaptation and mitigation, though uncertainties remain over their costs, feasibility and effectiveness (medium confidence). International environmental and sectoral agreements, institutions and initiatives are helping, and in some cases may help, to stimulate low GHG emissions investments and reduce emissions (medium confidence). Links to longer report2.2.2, 4.8.2
1 1The three Working Group contributions to AR6 are: AR6 Climate Change 2021: The Physical Science Basis; AR6 Climate Change 2022: Impacts, Adaptation and Vulnerability; and AR6 Climate Change 2022: Mitigation of Climate Change. Their assessments cover scientific literature accepted for publication respectively by 31 January 2021, 1 September 2021 and 11 October 2021.
2 2The three Special Reports are: Global Warming of 1.5°C (2018): an IPCC Special Report on the impacts of global warming of 1.5°C above pre-industrial levels and related global greenhouse gas emission pathways, in the context of strengthening the global response to the threat of climate change, sustainable development, and efforts to eradicate poverty (SR1.5); Climate Change and Land (2019): an IPCC Special Report on climate change, desertification, land degradation, sustainable land management, food security, and greenhouse gas fluxes in terrestrial ecosystems (SRCCL); and The Ocean and Cryosphere in a Changing Climate (2019) (SROCC). The Special Reports cover scientific literature accepted for publication respectively by 15 May 2018, 7 April 2019 and 15 May 2019.
3 3In this report, the near term is defined as the period until 2040. The long term is defined as the period beyond 2040.
4 Each finding is grounded in an evaluation of underlying evidence and agreement. The IPCC calibrated language uses five qualifiers to express a level of confidence: very low, low, medium, high and very high, and typeset in italics, for example, medium confidence. The following terms are used to indicate the assessed likelihood of an outcome or a result: virtually certain 99–100% probability, very likely 90–100%, likely 66–100%, more likely than not >50–100%, about as likely as not 33–66%, unlikely 0–33%, very unlikely 0–10%, exceptionally unlikely 0–1%. Additional terms (extremely likely 95–100%; more likely than not >50–100%; and extremely unlikely 0–5%) are also used when appropriate. Assessed likelihood is typeset in italics, e.g., very likely . This is consistent with AR5 and the other AR6 Reports.
5 5Ranges given throughout the SPM represent very likely ranges (5–95% range) unless otherwise stated.
6 The estimated increase in global surface temperature since AR5 is principally due to further warming since 2003-2012 (+0.19 [0.16 to 0.22] °C). Additionally, methodological advances and new datasets have provided a more complete spatial representation of changes in surface temperature, including in the Arctic. These and other improvements have also increased the estimate of global surface temperature change by approximately 0.1°C, but this increase does not represent additional physical warming since AR5.
7 The period distinction with A.1.1 arises because the attribution studies consider this slightly earlier period. The observed warming to 2010-2019 is 1.06 [0.88 to 1.21] °C.
8 Contributions from emissions to the 2010-2019 warming relative to 1850-1900 assessed from radiative forcing studies are: CO20.8 [0.5 to 1.2] °C; methane 0.5 [0.3 to 0.8] °C; nitrous oxide 0.1 [0.0 to 0.2] °C and fluorinated gases 0.1 [0.0 to 0.2] °C. {2.1.1}
9 GHG emission metrics are used to express emissions of different greenhouse gases in a common unit. Aggregated GHG emissions in this report are stated in CO2-equivalents (CO2-eq) using the Global Warming Potential with a time horizon of 100 years (GWP100) with values based on the contribution of Working Group I to the AR6. The AR6 WGI and WGIII reports contain updated emission metric values, evaluations of different metrics with regard to mitigation objectives, and assess new approaches to aggregating gases. The choice of metric depends on the purpose of the analysis and all GHG emission metrics have limitations and uncertainties, given that they simplify the complexity of the physical climate system and its response to past and future GHG emissions. {2.1.1}
10 GHG emission levels are rounded to two significant digits; as a consequence, small differences in sums due to rounding may occur. {2.1.1}
11 Territorial emissions.
12 Acute food insecurity can occur at any time with a severity that threatens lives, livelihoods or both, regardless of the causes, context or duration, as a result of shocks risking determinants of food security and nutrition, and is used to assess the need for humanitarian action. {2.1}
13 In this report, the term ‘losses and damages’ refer to adverse observed impacts and/or projected risks and can be economic and/or non-economic (see Annex I: Glossary).
14 Slow-onset events are described among the climatic-impact drivers of the AR6 WGI and refer to the risks and impacts associated with e.g., increasing temperature means, desertification, decreasing precipitation, loss of biodiversity, land and forest degradation, glacial retreat and related impacts, ocean acidification, sea level rise and salinization. {2.1.2}
15 Effectiveness refers here to the extent to which an adaptation option is anticipated or observed to reduce climate-related risk. {2.2.3}
16 See Annex I: Glossary. {2.2.3}
17 Ecosystem-based Adaptation (EbA) is recognized internationally under the Convention on Biological Diversity (CBD14/5). A related concept is Nature-based Solutions (NbS), see Annex I: Glossary.
18 Incremental adaptations to change in climate are understood as extensions of actions and behaviours that already reduce the losses or enhance the benefits of natural variations in extreme weather/climate events. {2.3.2}
19 In the literature, the terms pathways and scenarios are used interchangeably, with the former more frequently used in relation to climate goals. WGI primarily used the term scenarios and WGIII mostly used the term modelled emission and mitigation pathways. The SYR primarily uses scenarios when referring to WGI and modelled emission and mitigation pathways when referring to WGIII.
20 Around half of all modelled global emission pathways assume cost-effective approaches that rely on least-cost mitigation/abatement options globally. The other half looks at existing policies and regionally and sectorally differentiated actions.
21 SSP-based scenarios are referred to as SSPx-y, where ‘SSPx’ refers to the Shared Socioeconomic Pathway describing the socioeconomic trends underlying the scenarios, and ‘y’ refers to the level of radiative forcing (in watts per square metre, or W m -2) resulting from the scenario in the year 2100. {Cross-Section Box.2}
22 Very high emissions scenarios have become less likely but cannot be ruled out. Warming levels >4°C may result from very high emissions scenarios, but can also occur from lower emission scenarios if climate sensitivity or carbon cycle feedbacks are higher than the best estimate. {3.1.1}
23 RCP-based scenarios are referred to as RCPy, where ‘y’ refers to the level of radiative forcing (in watts per square metre, or W m -2) resulting from the scenario in the year 2100. The SSP scenarios cover a broader range of greenhouse gas and air pollutant futures than the RCPs. They are similar but not identical, with differences in concentration trajectories. The overall effective radiative forcing tends to be higher for the SSPs compared to the RCPs with the same label (medium confidence). {Cross-Section Box.2}
24 At least 1.8 GtCO2-eq yr –1 can be accounted for by aggregating separate estimates for the effects of economic and regulatory instruments. Growing numbers of laws and executive orders have impacted global emissions and were estimated to result in 5.9 GtCO2-eq yr –1 less emissions in 2016 than they otherwise would have been. (medium confidence). {2.2.2}
25 Reductions were linked to energy supply decarbonisation, energy efficiency gains, and energy demand reduction, which resulted from both policies and changes in economic structure (high confidence). {2.2.2}
26 Due to the literature cutoff date of WGIII, the additional NDCs submitted after 11 October 2021 are not assessed here. {Footnote 32 in the Longer Report}
27 Projected 2030 GHG emissions are 50 (47–55) GtCO2-eq if all conditional NDC elements are taken into account. Without conditional elements, the global emissions are projected to be approximately similar to modelled 2019 levels at 53 (50–57) GtCO2-eq. {2.3.1, Table 2.2}
28 Global warming (see Annex I: Glossary) is here reported as running 20-year averages, unless stated otherwise, relative to 1850-1900. Global surface temperature in any single year can vary above or below the long-term human-caused trend, due to natural variability. The internal variability of global surface temperature in a single year is estimated to be about ±0.25°C (5–95% range, high confidence). The occurrence of individual years with global surface temperature change above a certain level does not imply that this global warming level has been reached. {4.3, Cross-Section Box.2}
29 Median five-year interval at which a 1.5°C global warming level is reached (50% probability) in categories of modelled pathways considered in WGIII is 2030-2035. By 2030, global surface temperature in any individual year could exceed 1.5°C relative to 1850-1900 with a probability between 40% and 60%, across the five scenarios assessed in WGI (medium confidence). In all scenarios considered in WGI except the very high emissions scenario (SSP5-8.5), the midpoint of the first 20-year running average period during which the assessed average global surface temperature change reaches 1.5°C lies in the first half of the 2030s. In the very high GHG emissions scenario, the midpoint is in the late 2020s. {3.1.1, 3.3.1, 4.3} (Box SPM.1)
30 The best estimates [and very likely ranges] for the different scenarios are: 1.4 [1.0 to 1.8 ] °C (SSP1-1.9); 1.8 [1.3 to 2.4] °C (SSP1-2.6); 2.7 [2.1 to 3.5] °C (SSP2-4.5)); 3.6 [2.8 to 4.6] °C (SSP3-7.0); and 4.4 [3.3 to 5.7 ] °C (SSP5-8.5). {3.1.1} (Box SPM.1)
31 Assessed future changes in global surface temperature have been constructed, for the first time, by combining multi-model projections with observational constraints and the assessed equilibrium climate sensitivity and transient climate response. The uncertainty range is narrower than in the AR5 thanks to improved knowledge of climate processes, paleoclimate evidence and model-based emergent constraints. {3.1.1}
32 See Annex I: Glossary. Natural variability includes natural drivers and internal variability. The main internal variability phenomena include El Niño-Southern Oscillation, Pacific Decadal Variability and Atlantic Multi-decadal Variability. {4.3}
33 Based on additional scenarios.
34 Permafrost, seasonal snow cover, glaciers, the Greenland and Antarctic Ice Sheets, and Arctic Sea ice.
35 Based on 2500-year reconstructions, eruptions with a radiative forcing more negative than –1 W m -2, related to the radiative effect of volcanic stratospheric aerosols in the literature assessed in this report, occur on average twice per century. {4.3}
36 In all assessed regions.
37 Undetectable risk level indicates no associated impacts are detectable and attributable to climate change; moderate risk indicates associated impacts are both detectable and attributable to climate change with at least medium confidence, also accounting for the other specific criteria for key risks; high risk indicates severe and widespread impacts that are judged to be high on one or more criteria for assessing key risks; and very high risk level indicates very high risk of severe impacts and the presence of significant irreversibility or the persistence of climate-related hazards, combined with limited ability to adapt due to the nature of the hazard or impacts/risks. {3.1.2}
38 The Reasons for Concern (RFC) framework communicates scientific understanding about accrual of risk for five broad categories. RFC1: Unique and threatened systems: ecological and human systems that have restricted geographic ranges constrained by climate-related conditions and have high endemism or other distinctive properties. RFC2: Extreme weather events: risks/impacts to human health, livelihoods, assets and ecosystems from extreme weather events. RFC3: Distribution of impacts: risks/impacts that disproportionately affect particular groups due to uneven distribution of physical climate change hazards, exposure or vulnerability. RFC4: Global aggregate impacts: impacts to socio-ecological systems that can be aggregated globally into a single metric. RFC5: Large-scale singular events: relatively large, abrupt and sometimes irreversible changes in systems caused by global warming. See also Annex I: Glossary. {3.1.2, Cross-Section Box.2}
39 Net zero GHG emissions defined by the 100-year global warming potential. See footnote 9.
40 Global databases make different choices about which emissions and removals occurring on land are considered anthropogenic. Most countries report their anthropogenic land CO2 fluxes including fluxes due to human-caused environmental change (e.g., CO2 fertilisation) on ‘managed’ land in their national GHG inventories. Using emissions estimates based on these inventories, the remaining carbon budgets must be correspondingly reduced. {3.3.1}
41 For example, remaining carbon budgets could be 300 or 600 GtCO2 for 1.5°C (50%), respectively for high and low non-CO2 emissions, compared to 500 GtCO2 in the central case. {3.3.1}
42 Abatement here refers to human interventions that reduce the amount of greenhouse gases that are released from fossil fuel infrastructure to the atmosphere.
43 Ibid.
44 WGI provides carbon budgets that are in line with limiting global warming to temperature limits with different likelihoods, such as 50%, 67% or 83%. {3.3.1}
45 Uncertainties for total carbon budgets have not been assessed and could affect the specific calculated fractions.
46 Ibid.
47 CCS is an option to reduce emissions from large-scale fossil-based energy and industry sources provided geological storage is available. When CO2 is captured directly from the atmosphere (DACCS), or from biomass (BECCS), CCS provides the storage component of these CDR methods. CO2 capture and subsurface injection is a mature technology for gas processing and enhanced oil recovery. In contrast to the oil and gas sector, CCS is less mature in the power sector, as well as in cement and chemicals production, where it is a critical mitigation option. The technical geological storage capacity is estimated to be on the order of 1000 GtCO2, which is more than the CO2 storage requirements through 2100 to limit global warming to 1.5°C, although the regional availability of geological storage could be a limiting factor. If the geological storage site is appropriately selected and managed, it is estimated that the CO2 can be permanently isolated from the atmosphere. Implementation of CCS currently faces technological, economic, institutional, ecological-environmental and socio-cultural barriers. Currently, global rates of CCS deployment are far below those in modelled pathways limiting global warming to 1.5°C to 2°C. Enabling conditions such as policy instruments, greater public support and technological innovation could reduce these barriers. (high confidence){3.3.3}
48 The impacts, risks, and co-benefits of CDR deployment for ecosystems, biodiversity and people will be highly variable depending on the method, site-specific context, implementation and scale (high confidence).
49 The southern part of Mexico is included in the climactic subregion South Central America (SCA) for WGI. Mexico is assessed as part of North America for WGII. The climate change literature for the SCA region occasionally includes Mexico, and in those cases WGII assessment makes reference to Latin America. Mexico is considered part of Latin America and the Caribbean for WGIII.
50 The evidence is too limited to make a similar robust conclusion for limiting warming to 1.5°C. Limiting global warming to 1.5°C instead of 2°C would increase the costs of mitigation, but also increase the benefits in terms of reduced impacts and related risks, and reduced adaptation needs (high confidence).
51 In this context, ‘unabated fossil fuels’ refers to fossil fuels produced and used without interventions that substantially reduce the amount of GHG emitted throughout the life cycle; for example, capturing 90% or more CO2 from power plants, or 50–80% of fugitive methane emissions from energy supply.
52 A set of measures and daily practices that avoid demand for energy, materials, land, and water while delivering human well-being for all within planetary boundaries. {4.5.3}
53 ‘Sustainable healthy diets’ promote all dimensions of individuals’ health and well-being; have low environmental pressure and impact; are accessible, affordable, safe and equitable; and are culturally acceptable, as described in FAO and WHO. The related concept of ‘balanced diets’ refers to diets that feature plant-based foods, such as those based on coarse grains, legumes, fruits and vegetables, nuts and seeds, and animal-sourced food produced in resilient, sustainable and low-GHG emission systems, as described in SRCCL.
54 Fossil fuel subsidy removal is projected by various studies to reduce global CO2 emission by 1 to 4%, and GHG emissions by up to 10% by 2030, varying across regions (medium confidence).
55 Finance originates from diverse sources: public or private, local, national or international, bilateral or multilateral, and alternative sources. It can take the form of grants, technical assistance, loans (concessional and non-concessional), bonds, equity, risk insurance and financial guarantees (of different types).
56 These estimates rely on scenario assumptions.
57 Leading to lower net emission reductions or even emission increases.

