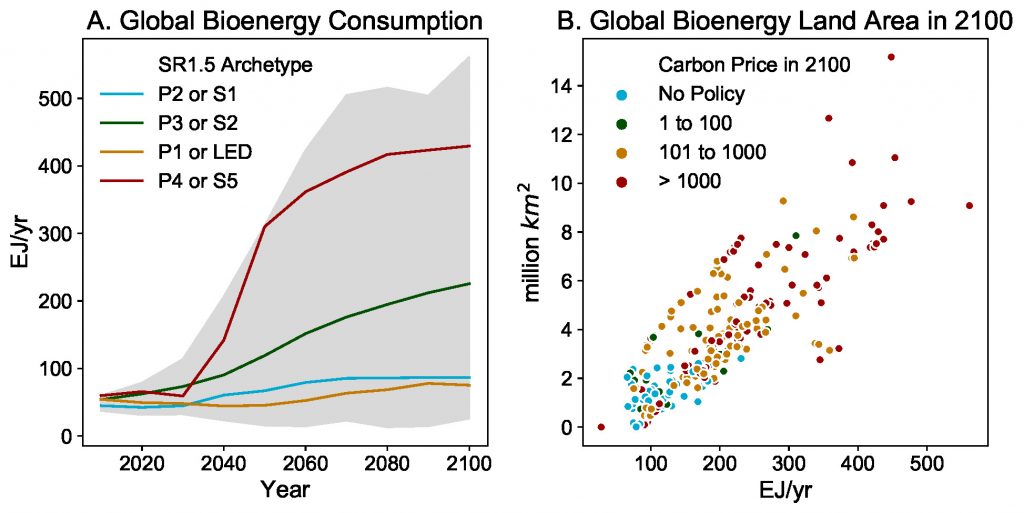
Global bioenergy consumption in IAM scenarios. Data is from an update of the Integrated Assessment Modelling Consortium (IAMC) Scenario Explorer developed for the SR15 (Huppmann et al. 2018; Rogelj et al. 2018a). The left panel A. shows bioenergy deployment over time for the entire scenario database (grey areas) and the four illustrative pathways from SR15 (Rogelj et al. 2018a). The right panel B. shows global land area for energy crops in 2100 versus total global bioenergy consumption in 2100; colours indicate the carbon price in 2100 (in 2010 USD per tCO2). Note that this figure includes 409 scenarios, many of which exceed 1.5°C.