Special Report: Special Report on Climate Change and Land
Ch 00

Summary for Policymakers

Drafting Authors

  • Almut Arneth (Germany)
  • Humberto Barbosa (Brazil)
  • Tim G. Benton (United Kingdom)
  • Katherine Calvin (United States)
  • Eduardo Calvo (Peru)
  • Sarah Connors (France, United Kingdom)
  • Annette Cowie (Australia)
  • Edouard Davin (Switzerland, France)
  • Fatima Denton (The Gambia)
  • Renée van Diemen (Netherlands, United Kingdom)
  • Fatima Driouech (Morocco)
  • Aziz Elbehri (Morocco)
  • Jason Evans (Australia)
  • Marion Ferrat (France)
  • Jordan Harold (United Kingdom)
  • Eamon Haughey (Ireland)
  • Mario Herrero (Australia, Costa Rica)
  • Joanna House (United Kingdom)
  • Mark Howden (Australia)
  • Margot Hurlbert (Canada)
  • Gensuo Jia (China)
  • Tom Gabriel Johansen (Norway)
  • Jagdish Krishnaswamy (India)
  • Werner Kurz (Canada)
  • Christopher Lennard (South Africa)
  • Soojeong Myeong (South Korea)
  • Nagmeldin Mahmoud (Sudan)
  • Valérie Masson-Delmotte (France)
  • Cheikh Mbow (Senegal)
  • Pamela McElwee (United States)
  • Alisher Mirzabaev (Germany, Uzbekistan)
  • Angela Morelli (Norway, Italy)
  • Wilfran Moufouma (France)
  • Dalila Nedjraoui (Algeria)
  • Suvadip Neogi (India)
  • Johnson Nkem (Cameroon)
  • Nathalie De Noblet-Ducoudré (France)
  • Lennart Olsson (Sweden)
  • Minal Pathak (India)
  • Jan Petzold (Germany)
  • Ramón Pichs-Madruga (Cuba)
  • Elvira Poloczanska (United Kingdom, Australia)
  • Alexander Popp (Germany)
  • Hans-Otto Pörtner (Germany)
  • Joana Portugal Pereira (Portugal, United Kingdom)
  • Prajal Pradhan (Germany, Nepal)
  • Andy Reisinger (New Zealand)
  • Debra C. Roberts (South Africa)
  • Cynthia Rosenzweig (United States)
  • Mark Rounsevell (United Kingdom)
  • Elena Shevliakova (United States)
  • Priyadarshi R. Shukla (India)
  • Jim Skea (United Kingdom)
  • Raphael Slade (United Kingdom)
  • Pete Smith (United Kingdom)
  • Youba Sokona (Mali)
  • Denis Jean Sonwa (Cameroon)
  • Jean-Francois Soussana (France)
  • Francesco N. Tubiello (United States, Italy)
  • Louis Verchot (Colombia, United States)
  • Koko Warner (United States, Germany)
  • Nora M. Weyer (Germany)
  • Jianguo Wu (China)
  • Noureddine Yassaa (Algeria)
  • Panmao Zhai (China)
  • Zinta Zommers (Latvia)
Figure SPM.1
View details
Figure SPM.2
View details
Figure SPM.3A
View details
Figure SPM.3B
View details
Figure SPM.4A
View details
Figure SPM.4B
View details
1

Introduction

This Special Report on Climate Change and Land 1 responds to the Panel decision in 2016 to prepare three Special Reports 2 during the Sixth Assessment cycle, taking account of proposals from governments and observer organisations.3 This report addresses greenhouse gas (GHG) fluxes in land-based ecosystems, land use and sustainable land management 4 in relation to climate change adaptation and mitigation, desertification 5, land degradation 6 and food security 7. This report follows the publication of other recent reports, including the IPCC Special Report on Global Warming of 1.5°C (SR15), the thematic assessment of the Intergovernmental Science-Policy Platform on Biodiversity and Ecosystem Services (IPBES) on Land Degradation and Restoration, the IPBES Global Assessment Report on Biodiversity and Ecosystem Services, and the Global Land Outlook of the UN Convention to Combat Desertification (UNCCD). This report provides an updated assessment of the current state of knowledge 8 while striving for coherence and complementarity with other recent reports.

This Summary for Policymakers (SPM) is structured in four parts: A) People, land and climate in a warming world; B) Adaptation and mitigation response options; C) Enabling response options; and, D) Action in the near-term.

Confidence in key findings is indicated using the IPCC calibrated language; the underlying scientific basis of each key finding is indicated by references to the main report.9


A

People, land and climate in a warming world

A.1        
Land provides the principal basis for human livelihoods and well-being including the supply of food, freshwater and multiple other ecosystem services, as well as biodiversity. Human use directly affects more than 70% (likely 69–76%) of the global, ice-free land surface (high confidence). Land also plays an important role in the climate system. (Figure SPM.1) {1.1, 1.2, 2.3, 2.4}

A.1.1
People currently use one quarter to one third of land’s potential net primary production 10 for food, feed, fibre, timber and energy. Land provides the basis for many other ecosystem functions and services,11 including cultural and regulating services, that are essential for humanity (high confidence). In one economic approach, the world’s terrestrial ecosystem services have been valued on an annual basis to be approximately equivalent to the annual global Gross Domestic Product 12 (medium confidence). (Figure SPM.1) {1.1, 1.2, 3.2, 4.1, 5.1, 5.5}

A.1.2
Land is both a source and a sink of GHGs and plays a key role in the exchange of energy, water and aerosols between the land surface and atmosphere. Land ecosystems and biodiversity are vulnerable to ongoing climate change, and weather and climate extremes, to different extents. Sustainable land management can contribute to reducing the negative impacts of multiple stressors, including climate change, on ecosystems and societies (high confidence). (Figure SPM.1) {1.1, 1.2, 3.2, 4.1, 5.1, 5.5}

A.1.3
Data available since 1961 13 show that global population growth and changes in per capita consumption of food, feed, fibre, timber and energy have caused unprecedented rates of land and freshwater use (very high confidence) with agriculture currently accounting for ca. 70% of global fresh-water use (medium confidence). Expansion of areas under agriculture and forestry, including commercial production, and enhanced agriculture and forestry productivity have supported consumption and food availability for a growing population (high confidence). With large regional variation, these changes have contributed to increasing net GHG emissions (very high confidence), loss of natural ecosystems (e.g., forests, savannahs, natural grasslands and wetlands) and declining biodiversity (high confidence). (Figure SPM.1) {1.1, 1.3, 5.1, 5.5}

A.1.4
Data available since 1961 shows the per capita supply of vegetable oils and meat has more than doubled and the supply of food calories per capita has increased by about one third (high confidence). Currently, 25–30% of total food produced is lost or wasted (medium confidence). These factors are associated with additional GHG emissions (high confidence). Changes in consumption patterns have contributed to about two billion adults now being overweight or obese (high confidence). An estimated 821 million people are still undernourished (high confidence). (Figure SPM.1) {1.1, 1.3, 5.1, 5.5}

A.1.5
About a quarter of the Earth’s ice-free land area is subject to human-induced degradation (medium confidence). Soil erosion from agricultural fields is estimated to be currently 10 to 20 times (no tillage) to more than 100 times (conventional tillage) higher than the soil formation rate (medium confidence). Climate change exacerbates land degradation, particularly in low-lying coastal areas, river deltas, drylands and in permafrost areas (high confidence). Over the period 1961–2013, the annual area of drylands in drought has increased, on average by slightly more than 1% per year, with large inter-annual variability. In 2015, about 500 (380-620) million people lived within areas which experienced desertification between the 1980s and 2000s. The highest numbers of people affected are in South and East Asia, the circum Sahara region including North Africa, and the Middle East including the Arabian Peninsula (low confidence). Other dryland regions have also experienced desertification. People living in already degraded or desertified areas are increasingly negatively affected by climate change (high confidence). (Figure SPM.1) {1.1, 1.2, 3.1, 3.2, 4.1, 4.2, 4.3}

Figure SPM.1

A representation of the land use and observed climate change covered in this assessment report. Panels A-F show the status and trends in selected land use and climate variables that represent many of the core topics covered in this report. The annual time series in B and D-F are based on the most comprehensive, available […]

A representation of the land use and observed climate change covered in this assessment report. Panels A-F show the status and trends in selected land use and climate variables that represent many of the core topics covered in this report. The annual time series in B and D-F are based on the most comprehensive, available data from national statistics, in most cases from FAOSTAT which starts in 1961. Y-axes in panels D-F are expressed relative to the starting year of the time series (rebased to zero). Data sources and notes: A: The warming curves are averages of four datasets {2.1, Figure 2.2, Table 2.1} B: N2O and CH4 from agriculture are from FAOSTAT; Net CO2 emissions from FOLU using the mean of two bookkeeping models (including emissions from peatland fires since 1997). All values expressed in units of CO2-eq are based on AR5 100-year Global Warming Potential values without climate-carbon feedbacks (N2O=265; CH4=28). (Table SPM.1) {1.1, 2.3} C: Depicts shares of different uses of the global, ice-free land area for approximately the year 2015, ordered along a gradient of decreasing land-use intensity from left to right. Each bar represents a broad land cover category; the numbers on top are the total percentage of the ice-free area covered, with uncertainty ranges in brackets. Intensive pasture is defined as having a livestock density greater than 100 animals/km². The area of ‘forest managed for timber and other uses’ was calculated as total forest area minus ‘primary/intact’ forest area. {1.2, Table 1.1, Figure 1.3} D: Note that fertiliser use is shown on a split axis. The large percentage change in fertiliser use reflects the low level of use in 1961 and relates to both increasing fertiliser input per area as well as the expansion of fertilised cropland and grassland to increase food production. {1.1, Figure 1.3} E: Overweight population is defined as having a body mass index (BMI) > 25 kg m-2; underweight is defined as BMI < 18.5 kg m-2. {5.1, 5.2} F: Dryland areas were estimated using TerraClimate precipitation and potential evapotranspiration (1980-2015) to identify areas where the Aridity Index is below 0.65. Population data are from the HYDE3.2 database. Areas in drought are based on the 12-month accumulation Global Precipitation Climatology Centre Drought Index. The inland wetland extent (including peatlands) is based on aggregated data from more than 2000 time series that report changes in local wetland area over time. {3.1, 4.2, 4.6}

A.2

Since the pre-industrial period, the land surface air temperature has risen nearly twice as much as the global average temperature (high confidence). Climate change, including increases in frequency and intensity of extremes, has adversely impacted food security and terrestrial ecosystems as well as contributed to desertification and land degradation in many regions (high confidence). {2.2, 3.2, 4.2, 4.3, 4.4, 5.1, 5.2, Executive Summary Chapter 7, 7.2}

A.2.1
Since the pre-industrial period (1850-1900) the observed mean land surface air temperature has risen considerably more than the global mean surface (land and ocean) temperature (GMST) (high confidence). From 1850-1900 to 2006-2015 mean land surface air temperature has increased by 1.53°C (very likely range from 1.38°C to 1.68°C) while GMST increased by 0.87°C (likely range from 0.75°C to 0.99°C). (Figure SPM.1) {2.2.1}

A.2.2
Warming has resulted in an increased frequency, intensity and duration of heat-related events, including heatwaves 14 in most land regions (high confidence). Frequency and intensity of droughts has increased in some regions (including the Mediterranean, west Asia, many parts of South America, much of Africa, and north-eastern Asia) (medium confidence) and there has been an increase in the intensity of heavy precipitation events at a global scale (medium confidence). {2.2.5, 4.2.3, 5.2}

A.2.3
Satellite observations 15 have shown vegetation greening 16 over the last three decades in parts of Asia, Europe, South America, central North America, and southeast Australia. Causes of greening include combinations of an extended growing season, nitrogen deposition, Carbon Dioxide (CO2) fertilisation 17, and land management (high confidence). Vegetation browning 18 has been observed in some regions including northern Eurasia, parts of North America, Central Asia and the Congo Basin, largely as a result of water stress (medium confidence). Globally, vegetation greening has occurred over a larger area than vegetation browning (high confidence). {2.2.3, Box 2.3, 2.2.4, 3.2.1, 3.2.2, 4.3.1, 4.3.2, 4.6.2, 5.2.2}

A.2.4
The frequency and intensity of dust storms have increased over the last few decades due to land use and land cover changes and climate-related factors in many dryland areas resulting in increasing negative impacts on human health, in regions such as the Arabian Peninsula and broader Middle East, Central Asia (high confidence). 19 {2.4.1, 3.4.2}

A.2.5
In some dryland areas, increased land surface air temperature and evapotranspiration and decreased precipitation amount, in interaction with climate variability and human activities, have contributed to desertification. These areas include Sub-Saharan Africa, parts of East and Central Asia, and Australia. (medium confidence) {2.2, 3.2.2, 4.4.1}

A.2.6
Global warming has led to shifts of climate zones in many world regions, including expansion of arid climate zones and contraction of polar climate zones (high confidence). As a consequence, many plant and animal species have experienced changes in their ranges, abundances, and shifts in their seasonal activities (high confidence). {2.2, 3.2.2, 4.4.1}

A.2.7
Climate change can exacerbate land degradation processes (high confidence) including through increases in rainfall intensity, flooding, drought frequency and severity, heat stress, dry spells, wind, sea-level rise and wave action, and permafrost thaw with outcomes being modulated by land management. Ongoing coastal erosion is intensifying and impinging on more regions with sea-level rise adding to land use pressure in some regions (medium confidence). {4.2.1, 4.2.2, 4.2.3, 4.4.1, 4.4.2, 4.9.6, Table 4.1, 7.2.1, 7.2.2}

A.2.8
Climate change has already affected food security due to warming, changing precipitation patterns, and greater frequency of some extreme events (high confidence). Studies that separate out climate change from other factors affecting crop yields have shown that yields of some crops (e.g., maize and wheat) in many lower-latitude regions have been affected negatively by observed climate changes, while in many higher-latitude regions, yields of some crops (e.g., maize, wheat, and sugar beets) have been affected positively over recent decades (high confidence). Climate change has resulted in lower animal growth rates and productivity in pastoral systems in Africa (high confidence). There is robust evidence that agricultural pests and diseases have already responded to climate change resulting in both increases and decreases of infestations (high confidence). Based on indigenous and local knowledge, climate change is affecting food security in drylands, particularly those in Africa, and high mountain regions of Asia and South America. 20 {5.2.1, 5.2.2, 7.2.2}

A.3        
Agriculture, Forestry and Other Land Use (AFOLU) activities accounted for around 13% of CO2, 44% of methane (CH4), and 81% of nitrous oxide (N2O) emissions from human activities globally during 2007-2016, representing 23% (12.0 ± 2.9 GtCO2eq yr-1) of total net anthropogenic emissions of GHGs (medium confidence). 21  The natural response of land to human-induced environmental change caused a net sink of around 11.2 GtCO2 yr-1 during 2007–2016 (equivalent to 29% of total CO2 emissions) (medium confidence); the persistence of the sink is uncertain due to climate change (high confidence). If emissions associated with pre- and post-production activities in the global food system 22 are included, the emissions are estimated to be 21–37% of total net anthropogenic GHG emissions (medium confidence). {2.3, Table 2.2, 5.4}

A.3.1
Land is simultaneously a source and a sink of CO2 due to both anthropogenic and natural drivers, making it hard to separate anthropogenic from natural fluxes (very high confidence).  Global models estimate net CO2 emissions of 5.2 ± 2.6 GtCO2 yr-1 (likely range) from land use and land-use change during 2007–2016. These net emissions are mostly due to deforestation, partly offset by afforestation/reforestation, and emissions and removals by other land use activities (very high confidence). 23 There is no clear trend in annual emissions since 1990 (medium confidence). (Figure SPM.1, Table SPM.1) {1.1, 2.3, Table 2.2, Table 2.3}

A.3.2
The natural response of land to human-induced environmental changes such as increasing atmospheric CO2 concentration, nitrogen deposition, and climate change, resulted in global net removals of 11.2 ± 2.6 GtCO2 yr–1 (likely range) during 2007–2016. The sum of the net removals due to this response and the AFOLU net emissions gives a total net land-atmosphere flux that removed 6.0 ± 3.7 GtCO2 yr-1 during 2007–2016 (likely range). Future net increases in CO2 emissions from vegetation and soils due to climate change are projected to counteract increased removals due to CO2 fertilisation and longer growing seasons (high confidence). The balance between these processes is a key source of uncertainty for determining the future of the land carbon sink. Projected thawing of permafrost is expected to increase the loss of soil carbon (high confidence). During the 21st century, vegetation growth in those areas may compensate in part for this loss (low confidence). (Table SPM.1) {Box 2.3, 2.3.1, 2.5.3, 2.7, Table 2.3}

A.3.3
Global models and national GHG inventories use different methods to estimate anthropogenic CO2 emissions and removals for the land sector. Both produce estimates that are in close agreement for land-use change involving forest (e.g., deforestation, afforestation), and differ for managed forest. Global models consider as managed forest those lands that were subject to harvest whereas, consistent with IPCC guidelines, national GHG inventories define managed forest more broadly. On this larger area, inventories can also consider the natural response of land to human-induced environmental changes as anthropogenic, while the global model approach (Table SPM.1) treats this response as part of the non-anthropogenic sink. For illustration, from 2005 to 2014, the sum of the national GHG inventories net emission estimates is 0.1 ± 1.0 GtCO2 yr-1, while the mean of two global bookkeeping models is 5.2 ± 2.6 GtCO2 yr-1 (likely range). Consideration of differences in methods can enhance understanding of land sector net emission estimates and their applications. {2.4.1, 2.7.3, Fig 2.5, Box 2.2}

Table SPM.1

Net anthropogenic emissions due to Agriculture, Forestry, and other Land Use (AFOLU) and non-AFOLU (Panel 1) and global food systems (average for 2007–2016)1 (Panel 2). Positive values represent emissions; negative values represent removals.

A.3.4
Global AFOLU emissions of methane in the period 2007–2016 were 161 ± 43 MtCH4 yr-1 (4.5 ± 1.2 GtCO2eq yr-1) (medium confidence). The globally averaged atmospheric concentration of CH4 shows a steady increase between the mid-1980s and early 1990s, slower growth thereafter until 1999, a period of no growth between 1999–2006, followed by a resumption of growth in 2007 (high confidence). Biogenic sources make up a larger proportion of emissions than they did before 2000 (high confidence). Ruminants and the expansion of rice cultivation are important contributors to the rising concentration (high confidence). (Figure SPM.1) {Table 2.2, 2.3.2, 5.4.2, 5.4.3}

A.3.5
Anthropogenic AFOLU N2O emissions are rising, and were 8.7 ± 2.5 MtN2O yr-1 (2.3 ± 0.7 GtCO2eq yr-1) during the period 2007-2016. Anthropogenic N2O emissions {Figure SPM.1, Table SPM.1} from soils are primarily due to nitrogen application including inefficiencies (over-application or poorly synchronised with crop demand timings) (high confidence). Cropland soils emitted around 3 MtN2O yr-1 (around 795 MtCO2 eq yr-1) during the period 2007–2016 (medium confidence). There has been a major growth in emissions from managed pastures due to increased manure deposition (medium confidence). Livestock on managed pastures and rangelands accounted for more than one half of total anthropogenic N2O emissions from agriculture in 2014 (medium confidence). {Table 2.1, 2.3.3, 5.4.2, 5.4.3}

A.3.6
Total net GHG emissions from AFOLU emissions represent 12.0 ± 2.9 GtCO2eq yr-1 during 2007–2016. This represents 23% of total net anthropogenic emissions {Table SPM.1}. 24 Other approaches, such as global food system, include agricultural emissions and land use change (i.e., deforestation and peatland degradation), as well as outside farm gate emissions from energy, transport and industry sectors for food production. Emissions within farm gate and from agricultural land expansion contributing to the global food system represent 16–27% of total anthropogenic emissions (medium confidence). Emissions outside the farm gate represent 5–10% of total anthropogenic emissions (medium confidence). Given the diversity of food systems, there are large regional differences in the contributions from different components of the food system (very high confidence). Emissions from agricultural production are projected to increase (high confidence), driven by population and income growth and changes in consumption patterns (medium confidence). {5.5, Table 5.4}


A.4        
Changes in land conditions,25 either from land-use or climate change, affect global and regional climate (high confidence). At the regional scale, changing land conditions can reduce or accentuate warming and affect the intensity, frequency and duration of extreme events. The magnitude and direction of these changes vary with location and season (high confidence). {Executive Summary Chapter 2, 2.3, 2.4, 2.5, 3.3}

A.4.1
Since the pre-industrial period, changes in land cover due to human activities have led to both a net release of CO2 contributing to global warming (high confidence), and an increase in global land albedo 26 causing surface cooling (medium confidence). Over the historical period, the resulting net effect on globally averaged surface temperature is estimated to be small (medium confidence). {2.4, 2.6.1, 2.6.2}

A.4.2
The likelihood, intensity and duration of many extreme events can be significantly modified by changes in land conditions, including heat related events such as heatwaves (high confidence) and heavy precipitation events (medium confidence). Changes in land conditions can affect temperature and rainfall in regions as far as hundreds of kilometres away (high confidence). {2.5.1, 2.5.2, 2.5.4, 3.3, Cross-Chapter Box 4 in Chapter 2}

A.4.3
Climate change is projected to alter land conditions with feedbacks on regional climate. In those boreal regions where the treeline migrates northward and/or the growing season lengthens, winter warming will be enhanced due to decreased snow cover and albedo while warming will be reduced during the growing season because of increased evapotranspiration (high confidence). In those tropical areas where increased rainfall is projected, increased vegetation growth will reduce regional warming (medium confidence). Drier soil conditions resulting from climate change can increase the severity of heat waves, while wetter soil conditions have the opposite effect (high confidence). {2.5.2, 2.5.3}

A.4.4
Desertification amplifies global warming through the release of CO2 linked with the decrease in vegetation cover (high confidence). This decrease in vegetation cover tends to increase local albedo, leading to surface cooling (high confidence). {3.3}

A.4.5
Changes in forest cover, for example from afforestation, reforestation and deforestation, directly affect regional surface temperature through exchanges of water and energy (high confidence). 27 Where forest cover increases in tropical regions cooling results from enhanced evapotranspiration (high confidence). Increased evapotranspiration can result in cooler days during the growing season (high confidence) and can reduce the amplitude of heat related events (medium confidence). In regions with seasonal snow cover, such as boreal and some temperate regions, increased tree and shrub cover also has a wintertime warming influence due to reduced surface albedo (high confidence). 28 {2.3, 2.4.3, 2.5.1, 2.5.2, 2.5.4}

A.4.6

Both global warming and urbanisation can enhance warming in cities and their surroundings (heat island effect), especially during heat related events, including heat waves (high confidence). Night-time temperatures are more affected by this effect than daytime temperatures (high confidence). Increased urbanisation can also intensify extreme rainfall events over the city or downwind of urban areas (medium confidence). {2.5.1, 2.5.2, 2.5.3, 4.9.1, Cross-Chapter Box 4 in Chapter 2}

Figure SPM.2

Risks to land-related human systems and ecosystems from global climate change, socio-economic development and mitigation choices in terrestrial ecosystems As in previous IPCC reports the literature was used to make expert judgements to assess the levels of global warming at which levels of risk are undetectable, moderate, high or very high, as described further in […]

Risks to land-related human systems and ecosystems from global climate change, socio-economic development and mitigation choices in terrestrial ecosystems As in previous IPCC reports the literature was used to make expert judgements to assess the levels of global warming at which levels of risk are undetectable, moderate, high or very high, as described further in Chapter 7 and other parts of the underlying report. The Figure indicates assessed risks at approximate warming levels which may be influenced by a variety of factors, including adaptation responses. The assessment considers adaptive capacity consistent with the SSP pathways as described below. Panel A: Risks to selected elements of the land system as a function of global mean surface temperature {2.1, Box 2.1, 3.5, 3.7.1.1, 4.4.1.1, 4.4.1.2, 4.4.1.3, 5.2.2, 5.2.3, 5.2.4, 5.2.5, 7.2, 7.3, Table SM7.1}. Links to broader systems are illustrative and not intended to be comprehensive. Risk levels are estimated assuming medium exposure and vulnerability driven by moderate trends in socioeconomic conditions broadly consistent with an SSP2 pathway. {Table SM7.4} Panel B: Risks associated with desertification, land degradation and food security due to climate change and patterns of socio-economic development. Increasing risks associated with desertification include population exposed and vulnerable to water scarcity in drylands. Risks related to land degradation include increased habitat degradation, population exposed to wildfire and floods and costs of floods. Risks to food security include availability and access to food, including population at risk of hunger, food price increases and increases in disability adjusted life years attributable due to childhood underweight. Risks are assessed for two contrasted socio-economic pathways (SSP1 and SSP3 {Box SPM.1}) excluding the effects of targeted mitigation policies. {3.5, 4.2.1.2, 5.2.2, 5.2.3, 5.2.4, 5.2.5, 6.1.4, 7.2, Table SM7.5} Risks are not indicated beyond 3°C because SSP1 does not exceed this level of temperature change. All panels: As part of the assessment, literature was compiled and data extracted into a summary table. A formal expert elicitation protocol (based on modified-Delphi technique and the Sheffield Elicitation Framework), was followed to identify risk transition thresholds. This included a multi-round elicitation process with two rounds of independent anonymous threshold judgement, and a final consensus discussion. Further information on methods and underlying literature can be found in Chapter 7 Supplementary Material.

A.5        
Climate change creates additional stresses on land, exacerbating existing risks to livelihoods, biodiversity, human and ecosystem health, infrastructure, and food systems (high confidence). Increasing impacts on land are projected under all future GHG emission scenarios (high confidence). Some regions will face higher risks, while some regions will face risks previously not anticipated (high confidence). Cascading risks with impacts on multiple systems and sectors also vary across regions (high confidence). (Figure SPM.2) {2.2, 3.5, 4.2, 4.4, 4.7, 5.1, 5.2, 5.8, 6.1, 7.2, 7.3, Cross-Chapter Box 9 in Chapter 6}

A.5.1
With increasing warming, the frequency, intensity and duration of heat related events including heatwaves are projected to continue to increase through the 21st century (high confidence). The frequency and intensity of droughts are projected to increase particularly in the Mediterranean region and southern Africa (medium confidence). The frequency and intensity of extreme rainfall events are projected to increase in many regions (high confidence). {2.2.5, 3.5.1, 4.2.3, 5.2}

A.5.2
With increasing warming, climate zones are projected to further shift poleward in the middle and high latitudes (high confidence). In high-latitude regions, warming is projected to increase disturbance in boreal forests, including drought, wildfire, and pest outbreaks (high confidence). In tropical regions, under medium and high GHG emissions scenarios, warming is projected to result in the emergence of unprecedented 29 climatic conditions by the mid to late 21st century (medium confidence). {2.2.4, 2.2.5, 2.5.3, 4.3.2}

A.5.3
Current levels of global warming are associated with moderate risks from increased dryland water scarcity, soil erosion, vegetation loss, wildfire damage, permafrost thawing, coastal degradation and tropical crop yield decline (high confidence). Risks, including cascading risks, are projected to become increasingly severe with increasing temperatures. At around 1.5°C of global warming the risks from dryland water scarcity, wildfire damage, permafrost degradation and food supply instabilities are projected to be high (medium confidence). At around 2°C of global warming the risk from permafrost degradation and food supply instabilities are projected to be very high (medium confidence). Additionally, at around 3°C of global warming risk from vegetation loss, wildfire damage, and dryland water scarcity are also projected to be very high (medium confidence). Risks from droughts, water stress, heat related events such as heatwaves and habitat degradation simultaneously increase between 1.5°C and 3°C warming (low confidence). (Figure SPM.2) {7.2.2, Cross-Chapter Box 9 in Chapter 6, Chapter 7 Supplementary Material}

A.5.4
The stability of food supply 30 is projected to decrease as the magnitude and frequency of extreme weather events that disrupt food chains increases (high confidence). Increased atmospheric CO2 levels can also lower the nutritional quality of crops (high confidence). In SSP2, global crop and economic models project a median increase of 7.6% (range of 1–23%) in cereal prices in 2050 due to climate change (RCP6.0), leading to higher food prices and increased risk of food insecurity and hunger (medium confidence). The most vulnerable people will be more severely affected (high confidence). {5.2.3, 5.2.4, 5.2.5, 5.8.1, 7.2.2.2, 7.3.1}

A.5.5
In drylands, climate change and desertification are projected to cause reductions in crop and livestock productivity (high confidence), modify the plant species mix and reduce biodiversity (medium confidence). Under SSP2, the dryland population vulnerable to water stress, drought intensity and habitat degradation is projected to reach 178 million people by 2050 at 1.5°C warming, increasing to 220 million people at 2°C warming, and 277 million people at 3°C warming (low confidence). {3.5.1, 3.5.2, 3.7.3}

A.5.6
Asia and Africa 31 are projected to have the highest number of people vulnerable to increased desertification. North America, South America, Mediterranean, southern Africa and central Asia may be increasingly affected by wildfire. The tropics and subtropics are projected to be most vulnerable to crop yield decline. Land degradation resulting from the combination of sea-level rise and more intense cyclones is projected to jeopardise lives and livelihoods in cyclone prone areas (very high confidence).  Within populations, women, the young, elderly and poor are most at risk (high confidence). {3.5.1, 3.5.2, 4.4, Table 4.1, 5.2.2, 7.2.2, Cross-Chapter Box 3 in Chapter 2}

A.5.7
Changes in climate can amplify environmentally induced migration both within countries and across borders (medium confidence), reflecting multiple drivers of mobility and available adaptation measures (high confidence). Extreme weather and climate or slow-onset events may lead to increased displacement, disrupted food chains, threatened livelihoods (high confidence), and contribute to exacerbated stresses for conflict (medium confidence). {3.4.2, 4.7.3, 5.2.3, 5.2.4, 5.2.5, 5.8.2, 7.2.2, 7.3.1}

A.5.8
Unsustainable land management has led to negative economic impacts (high confidence). Climate change is projected to exacerbate these negative economic impacts (high confidence). {4.3.1, 4.4.1, 4.7, 4.8.5, 4.8.6, 4.9.6, 4.9.7, 4.9.8, 5.2, 5.8.1, 7.3.4, 7.6.1, Cross-Chapter Box 10 in Chapter 7}

A.6        
The level of risk posed by climate change depends both on the level of warming and on how population, consumption, production, technological development, and land management patterns evolve (high confidence). Pathways with higher demand for food, feed, and water, more resource-intensive consumption and production, and more limited technological improvements in agriculture yields result in higher risks from water scarcity in drylands, land degradation, and food insecurity (high confidence). (Figure SPM.2b) {5.1.4, 5.2.3, 6.1.4, 7.2, Cross-Chapter Box 9 in Chapter 6}

A.6.1
Projected increases in population and income, combined with changes in consumption patterns, result in increased demand for food, feed, and water in 2050 in all SSPs (high confidence). These changes, combined with land management practices, have implications for land-use change, food insecurity, water scarcity, terrestrial GHG emissions, carbon sequestration potential, and biodiversity (high confidence). Development pathways in which incomes increase and the demand for land conversion is reduced, either through reduced agricultural demand or improved productivity, can lead to reductions in food insecurity (high confidence). All assessed future socio-economic pathways result in increases in water demand and water scarcity (high confidence). SSPs with greater cropland expansion result in larger declines in biodiversity (high confidence). {6.1.4}

A.6.2
Risks related to water scarcity in drylands are lower in pathways with low population growth, less increase in water demand, and high adaptive capacity, as in SSP1 {Box SPM.1}. In these scenarios the risk from water scarcity in drylands is moderate even at global warming of 3°C (low confidence). By contrast, risks related to water scarcity in drylands are greater for pathways with high population growth, high vulnerability, higher water demand, and low adaptive capacity, such as SSP3. In SSP3 the transition from moderate to high risk occurs between 1.2°C and 1.5°C (medium confidence). (Figure SPM.2b, Box SPM.1) {7.2}

A.6.3
Risks related to climate change driven land degradation are higher in pathways with a higher population, increased land-use change, low adaptive capacity and other barriers to adaptation (e.g., SSP3). These scenarios result in more people exposed to ecosystem degradation, fire, and coastal flooding (medium confidence). For land degradation, the projected transition from moderate to high risk occurs for global warming between 1.8°C and 2.8°C in SSP1 (low confidence) and between 1.4°C and 2°C in SSP3 (medium confidence). The projected transition from high to very high risk occurs between 2.2°C and 2.8°C for SSP3 (medium confidence). (Figure SPM.2b) {4.4, 7.2}


A.6.4
Risks related to food security are greater in pathways with lower income, increased food demand, increased food prices resulting from competition for land, more limited trade, and other challenges to adaptation (e.g., SSP3) (high confidence). For food security, the transition from moderate to high risk occurs for global warming between 2.5°C and 3.5°C in SSP1 (medium confidence) and between 1.3°C and 1.7°C in SSP3 (medium confidence). The transition from high to very high risk occurs between 2°C and 2.7°C for SSP3 (medium confidence). (Figure SPM.2b) {7.2}

A.6.5
Urban expansion is projected to lead to conversion of cropland leading to losses in food production (high confidence). This can result in additional risks to the food system. Strategies for reducing these impacts can include urban and peri-urban food production and management of urban expansion, as well as urban green infrastructure that can reduce climate risks in cities  32 (high confidence). (Figure SPM.3) {4.9.1, 5.5, 5.6, 6.3, 6.4, 7.5.6}

B

Adaptation and mitigation response options

B.1
Many land-related responses that contribute to climate change adaptation and mitigation can also combat desertification and land degradation and enhance food security. The potential for land-related responses and the relative emphasis on adaptation and mitigation is context specific, including the adaptive capacities of communities and regions. While land-related response options can make important contributions to adaptation and mitigation, there are some barriers to adaptation and limits to their contribution to global mitigation. (very high confidence) (Figure SPM.3) {2.6, 4.8, 5.6, 6.1, 6.3, 6.4}

B.1.1
Some land-related actions are already being taken that contribute to climate change adaptation, mitigation and sustainable development. The response options were assessed across adaptation, mitigation, combating desertification and land degradation, food security and sustainable development, and a select set of options deliver across all of these challenges. These options include, but are not limited to, sustainable food production, improved and sustainable forest management, soil organic carbon management, ecosystem conservation and land restoration, reduced deforestation and degradation, and reduced food loss and waste (high confidence). These response options require integration of biophysical, socioeconomic and other enabling factors. {6.3, 6.4.5, 7.5.6, Cross-Chapter Box 10 in Chapter 7}

B.1.2
While some response options have immediate impacts, others take decades to deliver measurable results. Examples of response options with immediate impacts include the conservation of high-carbon ecosystems such as peatlands, wetlands, rangelands, mangroves and forests. Examples that provide multiple ecosystem services and functions, but take more time to deliver, include afforestation and reforestation as well as the restoration of high-carbon ecosystems, agroforestry, and the reclamation of degraded soils (high confidence). {6.4.5, 7.5.6, Cross-Chapter Box 10 in Chapter 7}

B.1.3
The successful implementation of response options depends on consideration of local environmental and socio-economic conditions. Some options such as soil carbon management are potentially applicable across a broad range of land use types, whereas the efficacy of land management practices relating to organic soils, peatlands and wetlands, and those linked to freshwater resources, depends on specific agro-ecological conditions (high confidence). Given the site-specific nature of climate change impacts on food system components and wide variations in agroecosystems, adaptation and mitigation options and their barriers are linked to environmental and cultural context at regional and local levels (high confidence). Achieving land degradation neutrality depends on the integration of multiple responses across local, regional and national scales and across multiple sectors including agriculture, pasture, forest and water (high confidence). {4.8, 6.2, 6.3, 6.4.4, 7.5.6}

B.1.4
Land-based options that deliver carbon sequestration in soil or vegetation, such as afforestation, reforestation, agroforestry, soil carbon management on mineral soils, or carbon storage in harvested wood products, do not continue to sequester carbon indefinitely (high confidence). Peatlands, however, can continue to sequester carbon for centuries (high confidence). When vegetation matures or when vegetation and soil carbon reservoirs reach saturation, the annual removal of CO2 from the atmosphere declines towards zero, while carbon stocks can be maintained (high confidence). However, accumulated carbon in vegetation and soils is at risk from future loss (or sink reversal) triggered by disturbances such as flood, drought, fire, or pest outbreaks, or future poor management (high confidence). {6.4.1}

B.2
Most of the response options assessed contribute positively to sustainable development and other societal goals (high confidence). Many response options can be applied without competing for land and have the potential to provide multiple co-benefits (high confidence). A further set of response options has the potential to reduce demand for land, thereby enhancing the potential for other response options to deliver across each of climate change adaptation and mitigation, combating desertification and land degradation, and enhancing food security (high confidence). (Figure SPM.3) {4.8, 6.2, 6.3.6, 6.4.3}

B.2.1
A number of land management options, such as improved management of cropland and grazing lands, improved and sustainable forest management, and increased soil organic carbon content, do not require land use change and do not create demand for more land conversion (high confidence). Further, a number of response options such as increased food productivity, dietary choices and food losses, and waste reduction, can reduce demand for land conversion, thereby potentially freeing land and creating opportunities for enhanced implementation of other response options (high confidence). Response options that reduce competition for land are possible and are applicable at different scales, from farm to regional (high confidence). (Figure SPM.3) {4.8, 6.3.6, 6.4}

B.2.2
A wide range of adaptation and mitigation responses, e.g., preserving and restoring natural ecosystems such as peatland, coastal lands and forests, biodiversity conservation, reducing competition for land, fire management, soil management, and most risk management options (e.g., use of local seeds, disaster risk management, risk sharing instruments) have the potential to make positive contributions to sustainable development, enhancement of ecosystem functions and services and other societal goals (medium confidence). Ecosystem-based adaptation can, in some contexts, promote nature conservation while alleviating poverty and can even provide co-benefits by removing GHGs and protecting livelihoods (e.g., mangroves) (medium confidence). {6.4.3, 7.4.6.2}

B.2.3
Most of the land management-based response options that do not increase competition for land, and almost all options based on value chain management (e.g., dietary choices, reduced post-harvest losses, reduced food waste) and risk management, can contribute to eradicating poverty and eliminating hunger while promoting good health and wellbeing, clean water and sanitation, climate action, and life on land (medium confidence). {6.4.3}

B.3
Although most response options can be applied without competing for available land, some can increase demand for land conversion (high confidence). At the deployment scale of several GtCO2 yr-1, this increased demand for land conversion could lead to adverse side effects for adaptation, desertification, land degradation and food security (high confidence). If applied on a limited share of total land and integrated into sustainably managed landscapes, there will be fewer adverse side-effects and some positive co-benefits can be realised (high confidence). (Figure SPM.3) {4.5, 6.2, 6.4, Cross-Chapter Box 7 in Chapter 6}

B.3.1
If applied at scales necessary to remove CO2 from the atmosphere at the level of several GtCO2 yr-1, afforestation, reforestation and the use of land to provide feedstock for bioenergy with or without carbon capture and storage, or for biochar, could greatly increase demand for land conversion (high confidence). Integration into sustainably managed landscapes at appropriate scale can ameliorate adverse impacts (medium confidence). Reduced grassland conversion to croplands, restoration and reduced conversion of peatlands, and restoration and reduced conversion of coastal wetlands affect smaller land areas globally, and the impacts on land use change of these options are smaller or more variable (high confidence). (Figure SPM.3) {Cross-Chapter Box 7 in Chapter 6, 6.4}

B.3.2
While land can make a valuable contribution to climate change mitigation, there are limits to the deployment of land-based mitigation measures such as bioenergy crops or afforestation. Widespread use at the scale of several millions of km2 globally could increase risks for desertification, land degradation, food security and sustainable development (medium confidence). Applied on a limited share of total land, land-based mitigation measures that displace other land uses have fewer adverse side-effects and can have positive co-benefits for adaptation, desertification, land degradation or food security. (high confidence) (Figure SPM.3) {4.2, 4.5, 6.4; Cross-Chapter Box 7 in Chapter 6}

B.3.3
The production and use of biomass for bioenergy can have co-benefits, adverse side-effects, and risks for land degradation, food insecurity, GHG emissions and other environmental and sustainable development goals (high confidence). These impacts are context specific and depend on the scale of deployment, initial land use, land type, bioenergy feedstock, initial carbon stocks, climatic region and management regime, and other land-demanding response options can have a similar range of consequences (high confidence). The use of residues and organic waste as bioenergy feedstock can mitigate land use change pressures associated with bioenergy deployment, but residues are limited and the removal of residues that would otherwise be left on the soil could lead to soil degradation (high confidence). (Figure SPM.3) {2.6.1.5, Cross-Chapter Box 7 in Chapter 6}

B.3.4
For projected socioeconomic pathways with low population, effective land-use regulation, food produced in low-GHG emission systems and lower food loss and waste (SSP1), the transition from low to moderate risk to food security, land degradation and water scarcity in dry lands occur between 1 and 4 million km2 of bioenergy or bioenergy with carbon capture and storage (BECCS) (medium confidence). By contrast, in pathways with high population, low income and slow rates of technological change (SSP3), the transition from low to moderate risk occurs between 0.1 and 1 million km2 (medium confidence). (Box SPM.1) {6.4, Table SM7.6, Cross-Chapter Box 7 in Chapter 6}


B.4
Many activities for combating desertification can contribute to climate change adaptation with mitigation co-benefits, as well as to halting biodiversity loss with sustainable development co-benefits to society (high confidence). Avoiding, reducing and reversing desertification would enhance soil fertility, increase carbon storage in soils and biomass, while benefitting agricultural productivity and food security (high confidence). Preventing desertification is preferable to attempting to restore degraded land due to the potential for residual risks and maladaptive outcomes (high confidence). {3.6.1, 3.6.2, 3.6.3, 3.6.4, 3.7.1, 3.7.2}

B.4.1
Solutions that help adapt to and mitigate climate change while contributing to combating desertification are site and regionally specific and include inter alia: water harvesting and micro-irrigation, restoring degraded lands using drought-resilient ecologically appropriate plants, agroforestry, and other agroecological and ecosystem-based adaptation practices (high confidence). {3.3, 3.6.1, 3.7.2, 3.7.5, 5.2, 5.6}

B.4.2
Reducing dust and sand storms and sand dune movement can lessen the negative effects of wind erosion and improve air quality and health (high confidence). Depending on water availability and soil conditions, afforestation, tree planting and ecosystem restoration programs, which aim for the creation of windbreaks in the form of ‘green walls’ and ‘green dams’ using native and other climate resilient tree species with low water needs, can reduce sand storms, avert wind erosion, and contribute to carbon sinks, while improving micro-climates, soil nutrients and water retention (high confidence). {3.3, 3.6.1, 3.7.2, 3.7.5}

B.4.3
Measures to combat desertification can promote soil carbon sequestration (high confidence). Natural vegetation restoration and tree planting on degraded land enriches, in the long term, carbon in the topsoil and subsoil (medium confidence). Modelled rates of carbon sequestration following the adoption of conservation agriculture practices in drylands depend on local conditions (medium confidence). If soil carbon is lost, it may take a prolonged period of time for carbon stocks to recover. {3.1.4, 3.3, 3.6.1, 3.6.3, 3.7.1, 3.7.2}

B.4.4
Eradicating poverty and ensuring food security can benefit from applying measures promoting land degradation neutrality (including avoiding, reducing and reversing land degradation) in rangelands, croplands and forests, which contribute to combating desertification, while mitigating and adapting to climate change within the framework of sustainable development. Such measures include avoiding deforestation and locally suitable practices including management of rangeland and forest fires (high confidence). {3.4.2, 3.6.1, 3.6.2, 3.6.3, 4.8.5}

B.4.5
Currently there is a lack of knowledge of adaptation limits and potential maladaptation to combined effects of climate change and desertification. In the absence of new or enhanced adaptation options, the potential for residual risks and maladaptive outcomes is high (high confidence). Even when solutions are available, social, economic and institutional constraints could pose barriers to their implementation (medium confidence). Some adaptation options can become maladaptive due to their environmental impacts, such as irrigation causing soil salinisation or over extraction leading to ground-water depletion (medium confidence). Extreme forms of desertification can lead to the complete loss of land productivity, limiting adaptation options or reaching the limits to adaptation (high confidence). {Executive Summary Chapter 3, 3.6.4, 3.7.5, 7.4.9}

B.4.6
Developing, enabling and promoting access to cleaner energy sources and technologies can contribute to adaptation and mitigating climate change and combating desertification and forest degradation through decreasing the use of traditional biomass for energy while increasing the diversity of energy supply (medium confidence). This can have socioeconomic and health benefits, especially for women and children. (high confidence). The efficiency of wind and solar energy infrastructures is recognised; the efficiency can be affected in some regions by dust and sand storms (high confidence). {3.5.3, 3.5.4, 4.4.4, 7.5.2, Cross-Chapter Box 12 in Chapter 7}

B.5
Sustainable land management,33 including sustainable forest management,34 can prevent and reduce land degradation, maintain land productivity, and sometimes reverse the adverse impacts of climate change on land degradation (very high confidence). It can also contribute to mitigation and adaptation (high confidence). Reducing and reversing land degradation, at scales from individual farms to entire watersheds, can provide cost effective, immediate, and long-term benefits to communities and support several Sustainable Development Goals (SDGs) with co-benefits for adaptation (very high confidence) and mitigation (high confidence). Even with implementation of sustainable land management, limits to adaptation can be exceeded in some situations (medium confidence). {1.3.2, 4.1.5, 4.8, 7.5.6, Table 4.2}

B.5.1
Land degradation in agriculture systems can be addressed through sustainable land management, with an ecological and socioeconomic focus, with co-benefits for climate change adaptation. Management options that reduce vulnerability to soil erosion and nutrient loss include growing green manure crops and cover crops, crop residue retention, reduced/zero tillage, and maintenance of ground cover through improved grazing management (very high confidence). {4.8}

B.5.2
The following options also have mitigation co-benefits. Farming systems such as agroforestry, perennial pasture phases and use of perennial grains, can substantially reduce erosion and nutrient leaching while building soil carbon (high confidence). The global sequestration potential of cover crops would be about 0.44 ± 0.11 GtCO2 yr-1 if applied to 25% of global cropland (high confidence). The application of certain biochars can sequester carbon (high confidence),and improve soil conditions in some soil types/climates (medium confidence). {4.8.1.1, 4.8.1.3, 4.9.2, 4.9.5, 5.5.1, 5.5.4, Cross-Chapter Box 6 in Chapter 5}

B.5.3
Reducing deforestation and forest degradation lowers GHG emissions (high confidence), with an estimated technical mitigation potential of 0.4–5.8 GtCO2 yr-1. By providing long-term livelihoods for communities, sustainable forest management can reduce the extent of forest conversion to non-forest uses (e.g., cropland or settlements) (high confidence). Sustainable forest management aimed at providing timber, fibre, biomass, non-timber resources and other ecosystem functions and services, can lower GHG emissions and can contribute to adaptation (high confidence). {2.6.1.2, 4.1.5, 4.3.2, 4.5.3, 4.8.1.3, 4.8.3, 4.8.4}

B.5.4
Sustainable forest management can maintain or enhance forest carbon stocks, and can maintain forest carbon sinks, including by transferring carbon to wood products, thus addressing the issue of sink saturation (high confidence). Where wood carbon is transferred to harvested wood products, these can store carbon over the long-term and can substitute for emissions-intensive materials reducing emissions in other sectors (high confidence). Where biomass is used for energy, e.g., as a mitigation strategy, the carbon is released back into the atmosphere more quickly (high confidence). (Figure SPM.3) {2.6.1, 2.7, 4.1.5, 4.8.4, 6.4.1, Cross-Chapter Box 7 in Chapter 6}

B.5.5
Climate change can lead to land degradation, even with the implementation of measures intended to avoid, reduce or reverse land degradation (high confidence). Such limits to adaptation are dynamic, site-specific and are determined through the interaction of biophysical changes with social and institutional conditions (very high confidence). In some situations, exceeding the limits of adaptation can trigger escalating losses or result in undesirable transformational changes (medium confidence) such as forced migration (low confidence), conflicts (low confidence) or poverty (medium confidence). Examples of climate change induced land degradation that may exceed limits to adaptation include coastal erosion exacerbated by sea level rise where land disappears (high confidence), thawing of permafrost affecting infrastructure and livelihoods (medium confidence), and extreme soil erosion causing loss of productive capacity (medium confidence). {4.7, 4.8.5, 4.8.6, 4.9.6, 4.9.7, 4.9.8}

B.6
Response options throughout the food system, from production to consumption, including food loss and waste, can be deployed and scaled up to advance adaptation and mitigation (high confidence). The total technical mitigation potential from crop and livestock activities, and agroforestry is estimated as 2.3 – 9.6 GtCO2eq yr-1 by 2050 (medium confidence). The total technical mitigation potential of dietary changes is estimated as 0.7 – 8 GtCO2eq yr-1 by 2050 (medium confidence). {5.3, 5.5, 5.6}

B.6.1
Practices that contribute to climate change adaptation and mitigation in cropland include increasing soil organic matter, erosion control, improved fertiliser management, improved crop management, for example paddy rice management, and use of varieties and genetic improvements for heat and drought tolerance. For livestock, options include better grazing land management, improved manure management, higher-quality feed, and use of breeds and genetic improvement. Different farming and pastoral systems can achieve reductions in the emissions intensity of livestock products. Depending on the farming and pastoral systems and level of development, reductions in the emissions intensity of livestock products may lead to absolute reductions in GHG emissions (medium confidence). Many livestock related options can enhance the adaptive capacity of rural communities, in particular, of smallholders and pastoralists. Significant synergies exist between adaptation and mitigation, for example through sustainable land management approaches (high confidence). {4.8, 5.3.3, 5.5.1, 5.6}

B.6.2
Diversification in the food system (e.g., implementation of integrated production systems, broad-based genetic resources, and diets) can reduce risks from climate change (medium confidence). Balanced diets, featuring plant-based foods, such as those based on coarse grains, legumes, fruits and vegetables, nuts and seeds, and animal-sourced food produced in resilient, sustainable and low-GHG emission systems, present major opportunities for adaptation and mitigation while generating significant co-benefits in terms of human health (high confidence). By 2050, dietary changes could free several million km2 (medium confidence) of land and provide a technical mitigation potential of 0.7 to 8.0 GtCO2eq yr-1, relative to business as usual projections (high confidence). Transitions towards low-GHG emission diets may be influenced by local production practices, technical and financial barriers and associated livelihoods and cultural habits (high confidence).  {5.3, 5.5.2, 5.5, 5.6}

B.6.3
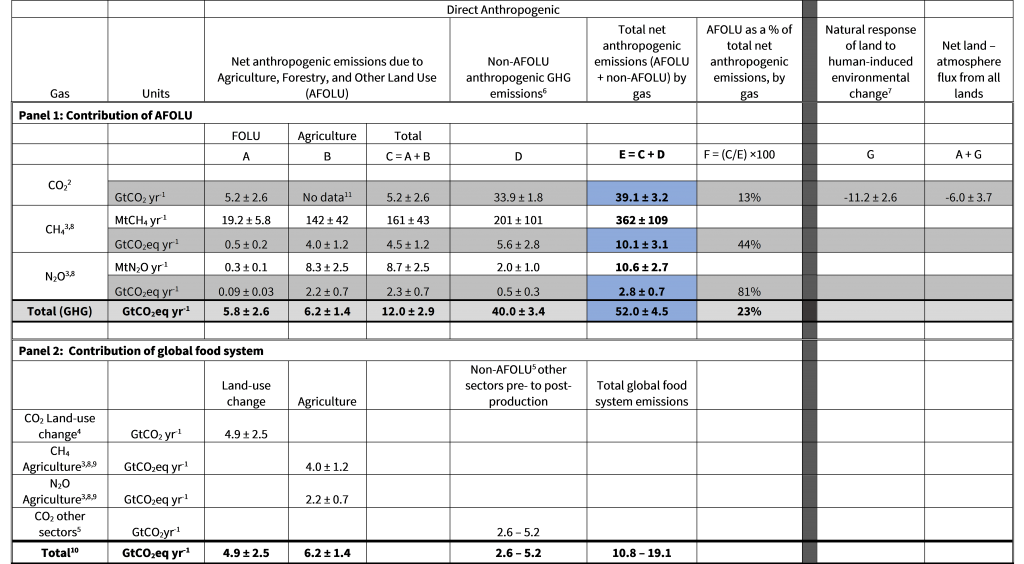
Reduction of food loss and waste can lower GHG emissions and contribute to adaptation through reduction in the land area needed for food production (medium confidence). During 2010-2016, global food loss and waste contributed 8 –10% of total anthropogenic GHG emissions (medium confidence). Currently, 25 –30% of total food produced is lost or wasted (medium confidence). Technical options such as improved harvesting techniques, on-farm storage, infrastructure, transport, packaging, retail and education can reduce food loss and waste across the supply chain. Causes of food loss and waste differ substantially between developed and developing countries, as well as between regions (medium confidence). By 2050, reduced food loss and waste can free several million km2 of land (low confidence). {5.5.2, 6.3.6}

B.7
Future land use depends, in part, on the desired climate outcome and the portfolio of response options deployed (high confidence). All assessed modelled pathways that limit warming to 1.5ºC or well below 2°C require land-based mitigation and land-use change, with most including different combinations of reforestation, afforestation, reduced deforestation, and bioenergy (high confidence). A small number of modelled pathways achieve 1.5ºC with reduced land conversion (high confidence) and thus reduced consequences for desertification, land degradation, and food security (medium confidence). (Figure SPM.4) {2.6, 6.4, 7.4, 7.6, Cross-Chapter Box 9 in Chapter 6}

B.7.1
Modelled pathways limiting global warming to 1.5ºC35 include more land-based mitigation than higher warming level pathways (high confidence), but the impacts of climate change on land systems in these pathways are less severe (medium confidence). (Figure SPM.2, Figure SPM.4) {2.6, 6.4, 7.4, Cross-Chapter Box 9 in Chapter 6}

B.7.2
Modelled pathways limiting global warming to 1.5°C and 2ºC project a 2 million km2 reduction to a 12 million km2 increase in forest area in 2050 relative to 2010 (medium confidence). 3ºC pathways project lower forest areas, ranging from a 4 million km2 reduction to a 6 million km2 increase (medium confidence). (Figure SPM.3, Figure SPM.4) {2.5, 6.3, 7.3, 7.5, Cross-Chapter Box 9 in Chapter 6}

B.7.3
The land area needed for bioenergy in modelled pathways varies significantly depending on the socio-economic pathway, the warming level, and the feedstock and production system used (high confidence). Modelled pathways limiting global warming to 1.5°C use up to 7 million km2 for bioenergy in 2050; bioenergy land area is smaller in 2°C (0.4 to 5 million km2) and 3°C pathways (0.1 to 3 million km2) (medium confidence). Pathways with large levels of land conversion may imply adverse side-effects impacting water scarcity, biodiversity, land degradation, desertification, and food security, if not adequately and carefully managed, whereas best practice implementation at appropriate scales can have co-benefits, such as management of dryland salinity, enhanced biocontrol and biodiversity and enhancing soil carbon sequestration (high confidence). (Figure SPM.3) {2.6, 6.1, 6.4, 7.2, Cross-Chapter Box 7 in Chapter 6}

B.7.4
Most mitigation pathways include substantial deployment of bioenergy technologies. A small number of modelled pathways limit warming to 1.5ºC with reduced dependence on bioenergy and BECCS (land area below <1 million km2 in 2050) and other carbon dioxide removal (CDR) options (high confidence). These pathways have even more reliance on rapid and far-reaching transitions in energy, land, urban systems and infrastructure, and on behavioural and lifestyle changes compared to other 1.5°C pathways. {2.6.2, 5.5.1, 6.4, Cross-Chapter Box 7 in Chapter 6}

B.7.5
These modelled pathways do not consider the effects of climate change on land or CO2 fertilisation. In addition, these pathways include only a subset of the response options assessed in this report (high confidence); the inclusion of additional response options in models could reduce the projected need for bioenergy or CDR that increases the demand for land. {6.4.4, Cross-Chapter Box 9 in Chapter 6}


Figure SPM.3A

Figure SPM.3B

This Figure is based on an aggregation of information from studies with a wide variety of assumptions about how response options are implemented and the contexts in which they occur. Response options implemented differently at local to global scales could lead to different outcomes. Magnitude of potential: For panel A, magnitudes are for the technical […]

This Figure is based on an aggregation of information from studies with a wide variety of assumptions about how response options are implemented and the contexts in which they occur. Response options implemented differently at local to global scales could lead to different outcomes. Magnitude of potential: For panel A, magnitudes are for the technical potential of response options globally. For each land challenge, magnitudes are set relative to a marker level as follows. For mitigation, potentials are set relative to the approximate potentials for the response options with the largest individual impacts (~3 GtCO2-eq yr-1). The threshold for the ‘large’ magnitude category is set at this level. For adaptation, magnitudes are set relative to the 100 million lives estimated to be affected by climate change and a carbon-based economy between 2010 and 2030. The threshold for the ‘large’ magnitude category represents 25% of this total. For desertification and land degradation, magnitudes are set relative to the lower end of current estimates of degraded land, 10–60 million km2. The threshold for the ‘large’ magnitude category represents 30% of the lower estimate. For food security, magnitudes are set relative to the approximately 800 million people who are currently undernourished. The threshold for the ‘large’ magnitude category represents 12.5% of this total. For panel B, for the first row (high level implementation) for each response option, the magnitude and thresholds are as defined for panel A. In the second row (best practice implementation) for each response option, the qualitative assessments that are green denote potential positive impacts, and those shown in grey indicate neutral interactions. Increased food production is assumed to be achieved through sustainable intensification rather than through injudicious application of additional external inputs such as agrochemicals. Levels of confidence: Confidence in the magnitude category (high, medium or low) into which each option falls for mitigation, adaptation, combating desertification and land degradation, and enhancing food security. High confidence means that there is a high level of agreement and evidence in the literature to support the categorisation as high, medium or low magnitude. Low confidence denotes that the categorisation of magnitude is based on few studies. Medium confidence reflects medium evidence and agreement in the magnitude of response. Cost ranges: Cost estimates are based on aggregation of often regional studies and vary in the components of costs that are included. In panel B, cost estimates are not provided for best practice implementation. One coin indicates low cost (<USD10 tCO2-eq-1 or <USD20 ha-1), two coins indicate medium cost (USD10-USD100 tCO2-eq-1 or USD20 –USD200 ha-1), and three coins indicate high cost (>USD100 tCO2-eq-1 or USD200 ha-1). Thresholds in USD ha-1 are chosen to be comparable, but precise conversions will depend on the response option. Supporting evidence: Supporting evidence for the magnitude of the quantitative potential for land management-based response options can be found as follows: for mitigation Table’s 6.13 to 6.20, with further evidence in Section 2.7.1; for adaptation Table’s 6.21 to 6.28; for combating desertification Table’s 6.29 to 6.36, with further evidence in Chapter 3; for combating degradation tables 6.37 to 6.44, with further evidence in Chapter 4; for enhancing food security Table’s 6.45 to 6.52, with further evidence in Chapter 5. Other synergies and trade-offs not shown here are discussed in Chapter 6. Additional supporting evidence for the qualitative assessments in the second row for each option in panel B can be found in the Table’s 6.6, 6.55, 6.56 and 6.58, Section 6.3.5.1.3, and Box 6.1c.

C

Enabling response options

C.1
Appropriate design of policies, institutions and governance systems at all scales can contribute to land-related adaptation and mitigation while facilitating the pursuit of climate-adaptive development pathways (high confidence). Mutually supportive climate and land policies have the potential to save resources, amplify social resilience, support ecological restoration, and foster engagement and collaboration between multiple stakeholders (high confidence). (Figure SPM.1, Figure SPM.2, Figure SPM.3) {3.6.2, 3.6.3, 4.8, 4.9.4, 5.7, 6.3, 6.4, 7.2.2, 7.3, 7.4, 7.4.7, 7.4.8, 7.5, 7.5.5, 7.5.6, 7.6.6, Cross-Chapter Box 10 in Chapter 7}

C.1.1
Land-use zoning, spatial planning, integrated landscape planning, regulations, incentives (such as payment for ecosystem services), and voluntary or persuasive instruments (such as environmental farm planning, standards and certification for sustainable production, use of scientific, local and indigenous knowledge and collective action), can achieve positive adaptation and mitigation outcomes (medium confidence). They can also contribute revenue and provide incentive to rehabilitate degraded lands and adapt to and mitigate climate change in certain contexts (medium confidence). Policies promoting the target of land degradation neutrality can also support food security, human wellbeing and climate change adaptation and mitigation (high confidence). (Figure SPM.2) {3.4.2, 4.1.6, 4.7, 4.8.5, 5.1.2, 5.7.3, 7.3, 7.4.6, 7.4.7, 7.5}

C.1.2
Insecure land tenure affects the ability of people, communities and organisations to make changes to land that can advance adaptation and mitigation (medium confidence). Limited recognition of customary access to land and ownership of land can result in increased vulnerability and decreased adaptive capacity (medium confidence). Land policies (including recognition of customary tenure, community mapping, redistribution, decentralisation, co-management, regulation of rental markets) can provide both security and flexibility response to climate change (medium confidence). {3.6.1, 3.6.2, 5.3, 7.2.4, 7.6.4, Cross-Chapter Box 6 in Chapter 5}

C.1.3
Achieving land degradation neutrality will involve a balance of measures that avoid and reduce land degradation, through adoption of sustainable land management, and measures to reverse degradation through rehabilitation and restoration of degraded land. Many interventions to achieve land degradation neutrality commonly also deliver climate change adaptation and mitigation benefits. The pursuit of land degradation neutrality provides impetus to address land degradation and climate change simultaneously (high confidence). {4.5.3, 4.8.5, 4.8.7, 7.4.5}

C.1.4
Due to the complexity of challenges and the diversity of actors involved in addressing land challenges, a mix of policies, rather than single policy approaches, can deliver improved results in addressing the complex challenges of sustainable land management and climate change (high confidence). Policy mixes can strongly reduce the vulnerability and exposure of human and natural systems to climate change (high confidence).  Elements of such policy mixes may include weather and health insurance, social protection and adaptive safety nets, contingent finance and reserve funds, universal access to early warning systems combined with effective contingency plans (high confidence). (Figure SPM.4} {1.2, 4.8, 4.9.2, 5.3.2, 5.6, 5.6.6, 5.7.2, 7.3.2, 7.4, 7.4.2, 7.4.6, 7.4.7, 7.4.8, 7.5.5, 7.5.6, 7.6.4}

C.2
Policies that operate across the food system, including those that reduce food loss and waste and influence dietary choices, enable more sustainable land-use management, enhanced food security and low emissions trajectories (high confidence). Such policies can contribute to climate change adaptation and mitigation, reduce land degradation, desertification and poverty as well as improve public health (high confidence). The adoption of sustainable land management and poverty eradication can be enabled by improving access to markets, securing land tenure, factoring environmental costs into food, making payments for ecosystem services, and enhancing local and community collective action (high confidence). {1.1.2, 1.2.1, 3.6.3, 4.7.1, 4.7.2, 4.8, 5.5, 6.4, 7.4.6, 7.6.5}

C.2.1
Policies that enable and incentivise sustainable land management for climate change adaptation and mitigation include improved access to markets for inputs, outputs and financial services, empowering women and indigenous peoples, enhancing local and community collective action, reforming subsidies and promoting an enabling trade system (high confidence). Land restoration and rehabilitation efforts can be more effective when policies support local management of natural resources, while strengthening cooperation between actors and institutions, including at the international level. {3.6.3, 4.1.6, 4.5.4, 4.8.2, 4.8.4, 5.7, 7.2, 7.3}

C.2.2
Reflecting the environmental costs of land-degrading agricultural practices can incentivise more sustainable land management (high confidence). Barriers to the reflection of environmental costs arise from technical difficulties in estimating these costs and those embodied in foods. {3.6.3, 5.5.1, 5.5.2, 5.6.6, 5.7, 7.4.4, Cross-Chapter Box 10 in Chapter 7}

C.2.3
Adaptation and enhanced resilience to extreme events impacting food systems can be facilitated by comprehensive risk management, including risk sharing and transfer mechanisms (high confidence). Agricultural diversification, expansion of market access, and preparation for increasing supply chain disruption can support the scaling up of adaptation in food systems (high confidence). {5.3.2, 5.3.3, 5.3.5}

C.2.4
Public health policies to improve nutrition, such as increasing the diversity of food sources in public procurement, health insurance, financial incentives, and awareness-raising campaigns, can potentially influence food demand, reduce healthcare costs, contribute to lower GHG emissions and enhance adaptive capacity (high confidence). Influencing demand for food, through promoting diets based on public health guidelines, can enable more sustainable land management and contribute to achieving multiple SDGs (high confidence). {3.4.2, 4.7.2, 5.1, 5.7, 6.3, 6.4}

C.3
Acknowledging co-benefits and trade-offs when designing land and food policies can overcome barriers to implementation (medium confidence). Strengthened multi-level, hybrid and cross-sectoral governance, as well as policies developed and adopted in an iterative, coherent, adaptive and flexible manner can maximise co-benefits and minimise trade-offs, given that land management decisions are made from farm level to national scales, and both climate and land policies often range across multiple sectors, departments and agencies (high confidence). (Figure SPM.3) {4.8.5, 4.9, 5.6, 6.4, 7.3, 7.4.6, 7.4.8, 7.4.9, 7.5.6, 7.6}

C.3.1.2
Addressing desertification, land degradation, and food security in an integrated, coordinated and coherent manner can assist climate resilient development and provides numerous potential co-benefits (high confidence). {3.7.5, 4.8, 5.6, 5.7, 6.4, 7.2.2, 7.3.1, 7.3.4, 7.4.7, 7.4.8, 7.5.6, 7.5.5}

C.3.2
Technological, biophysical, socio-economic, financial and cultural barriers can limit the adoption of many land-based response options, as can uncertainty about benefits (high confidence). Many sustainable land management practices are not widely adopted due to insecure land tenure, lack of access to resources and agricultural advisory services, insufficient and unequal private and public incentives, and lack of knowledge and practical experience (high confidence). Public discourse, carefully designed policy interventions, incorporating social learning and market changes can together help reduce barriers to implementation (medium confidence). {3.6.1, 3.6.2, 5.3.5, 5.5.2, 5.6, 6.2, 6.4, 7.4, 7.5, 7.6}

C.3.3
The land and food sectors face particular challenges of institutional fragmentation and often suffer from a lack of engagement between stakeholders at different scales and narrowly focused policy objectives (medium confidence). Coordination with other sectors, such as public health, transportation, environment, water, energy and infrastructure, can increase co-benefits, such as risk reduction and improved health (medium confidence). {5.6.3, 5.7, 6.2, 6.4.4, 7.1, 7.3, 7.4.8, 7.6.2, 7.6.3}

C.3.4
Some response options and policies may result in trade-offs, including social impacts, ecosystem functions and services damage, water depletion, or high costs, that cannot be well-managed, even with institutional best practices (medium confidence). Addressing such trade-offs helps avoid maladaptation (medium confidence). Anticipation and evaluation of potential trade-offs and knowledge gaps supports evidence-based policymaking to weigh the costs and benefits of specific responses for different stakeholders (medium confidence). Successful management of trade-offs often includes maximising stakeholder input with structured feedback processes, particularly in community-based models, use of innovative fora like facilitated dialogues or spatially explicit mapping, and iterative adaptive management that allows for continuous readjustments in policy as new evidence comes to light (medium confidence). {5.3.5, 6.4.2, 6.4.4, 6.4.5, 7.5.6, Cross-Chapter Box 9 in Chapter 7}

C.4
The effectiveness of decision-making and governance is enhanced by the involvement of local stakeholders (particularly those most vulnerable to climate change including indigenous peoples and local communities, women, and the poor and marginalised) in the selection, evaluation, implementation and monitoring of policy instruments for land-based climate change adaptation and mitigation (high confidence). Integration across sectors and scales increases the chance of maximising co-benefits and minimising trade-offs (medium confidence). {1.4, 3.1, 3.6, 3.7, 4.8, 4.9, 5.1.3, Box 5.1, 7.4, 7.6}

C.4.1
Successful implementation of sustainable land management practices requires accounting for local environmental and socio-economic conditions (very high confidence). Sustainable land management in the context of climate change is typically advanced by involving all relevant stakeholders in identifying land-use pressures and impacts (such as biodiversity decline, soil loss, over-extraction of groundwater, habitat loss, land-use change in agriculture, food production and forestry) as well as preventing, reducing and restoring degraded land (medium confidence). {1.4.1, 4.1.6, 4.8.7, 5.2.5, 7.2.4, 7.6.2, 7.6.4}

C.4.2
Inclusiveness in the measurement, reporting and verification of the performance of policy instruments can support sustainable land management (medium confidence). Involving stakeholders in the selection of indicators, collection of climate data, land modelling and land-use planning, mediates and facilitates integrated landscape planning and choice of policy (medium confidence). {3.7.5, 5.7.4, 7.4.1, 7.4.4, 7.5.3, 7.5.4, 7.5.5, 7.6.4, 7.6.6}

C.4.3
Agricultural practices that include indigenous and local knowledge can contribute to overcoming the combined challenges of climate change, food security, biodiversity conservation, and combating desertification and land degradation (high confidence). Coordinated action across a range of actors including businesses, producers, consumers, land managers and policymakers in partnership with indigenous peoples and local communities enable conditions for the adoption of response options (high confidence) {3.1.3, 3.6.1, 3.6.2, 4.8.2, 5.5.1, 5.6.4, 5.7.1, 5.7.4, 6.2, 7.3, 7.4.6, 7.6.4}

C.4.4
Empowering women can bring synergies and co-benefits to household food security and sustainable land management (high confidence). Due to women’s disproportionate vulnerability to climate change impacts, their inclusion in land management and tenure is constrained. Policies that can address land rights and barriers to women’s participation in sustainable land management include financial transfers to women under the auspices of anti-poverty programmes, spending on health, education, training and capacity building for women, subsidised credit and program dissemination through existing women’s community-based organisations (medium confidence). {1.4.1, 4.8.2, 5.1.3, Cross-Chapter Box 11 in Chapter 7}


Figure SPM.4A

Figure SPM.4B

Future scenarios provide a framework for understanding the implications of mitigation and socioeconomics on land. The Shared Socioeconomic Pathways (SSPs) span a range of different socioeconomic assumptions (Box SPM.1). They are combined with Representative Concentration Pathways (RCPs) which imply different levels of mitigation. The changes in cropland, pasture, bioenergy cropland, forest, and natural land from […]

Future scenarios provide a framework for understanding the implications of mitigation and socioeconomics on land. The Shared Socioeconomic Pathways (SSPs) span a range of different socioeconomic assumptions (Box SPM.1). They are combined with Representative Concentration Pathways (RCPs)36 which imply different levels of mitigation. The changes in cropland, pasture, bioenergy cropland, forest, and natural land from 2010 are shown. For this Figure, Cropland includes all land in food, feed, and fodder crops, as well as other arable land (cultivated area). This category includes first generation non-forest bioenergy crops (e.g., corn for ethanol, sugar cane for ethanol, soybeans for biodiesel), but excludes second generation bioenergy crops. Pasture includes categories of pasture land, not only high-quality rangeland, and is based on FAO definition of ‘permanent meadows and pastures’. Bioenergy cropland includes land dedicated to second generation energy crops (e.g., switchgrass, miscanthus, fast-growing wood species). Forest includes managed and unmanaged forest. Natural land includes other grassland, savannah, and shrubland. Panel A: This panel shows integrated assessment model (IAM) 37results for SSP1, SSP2 and SSP5 at RCP1.9.38 For each pathway, the shaded areas show the range across all IAMs; the line indicates the median across models. For RCP1.9, SSP1, SSP2 and SSP5 results are from five, four and two IAMs respectively. Panel B: Land use and land cover change are indicated for various SSP-RCP combinations, showing multi-model median and range (min, max). (Box SPM.1) {1.3.2, 2.7.2, 6.1, 6.4.4, 7.4.2, 7.4.4, 7.4.5, 7.4.6, 7.4.7, 7.4.8, 7.5.3, 7.5.6, Cross-Chapter Box 1 in Chapter 1, Cross-Chapter Box 9 in Chapter 6}

D

Action in the near-term

D.1
Actions can be taken in the near-term, based on existing knowledge, to address desertification, land degradation and food security while supporting longer-term responses that enable adaptation and mitigation to climate change. These include actions to build individual and institutional capacity, accelerate knowledge transfer, enhance technology transfer and deployment, enable financial mechanisms, implement early warning systems, undertake risk management and address gaps in implementation and upscaling (high confidence). {3.6.1, 3.6.2, 3.7.2, 4.8, 5.3.3, 5.5, 5.6.4, 5.7, 6.2, 6.4, 7.3, 7.4, 7.6, Cross-Chapter Box 10 in Chapter 7}

D.1.1
Near-term capacity-building, technology transfer and deployment, and enabling financial mechanisms can strengthen adaptation and mitigation in the land sector. Knowledge and technology transfer can help enhance the sustainable use of natural resources for food security under a changing climate (medium confidence). Raising awareness, capacity building and education about sustainable land management practices, agricultural extension and advisory services, and expansion of access to agricultural services to producers and land users can effectively address land degradation (medium confidence). {3.1, 5.7.4, 7.2, 7.3.4, 7.5.4}

D.1.2
Measuring and monitoring land use change including land degradation and desertification is supported by the expanded use of new information and communication technologies (cell phone based applications, cloud-based services, ground sensors, drone imagery), use of climate services, and remotely sensed land and climate information on land resources (medium confidence). Early warning systems for extreme weather and climate events are critical for protecting lives and property and enhancing disaster risk reduction and management (high confidence). Seasonal forecasts and early warning systems are critical for food security (famine) and biodiversity monitoring including pests and diseases and adaptive climate risk management (high confidence). There are high returns on investments in human and institutional capacities. These investments include access to observation and early warning systems, and other services derived from in-situ hydro-meteorological and remote sensing-based monitoring systems and data, field observation, inventory and survey, and expanded use of digital technologies (high confidence). {1.2, 3.6.2, 4.2.2, 4.2.4, 5.3.1, 5.3.6, 6.4, 7.3.4, 7.4.3, 7.5.4, 7.5.5, 7.6.4, Cross-Chapter Box 5 in Chapter 3}

D.1.3
Framing land management in terms of risk management, specific to land, can play an important role in adaptation through landscape approaches, biological control of outbreaks of pests and diseases, and improving risk sharing and transfer mechanisms (high confidence). Providing information on climate-related risk can improve the capacity of land managers and enable timely decision making (high confidence). {5.3.2, 5.3.5, 5.6.2, 5.6.3 5.6.5, 5.7.1, 5.7.2, 7.2.4, Cross-Chapter Box 6 in Chapter 5}

D.1.4
Sustainable land management can be improved by increasing the availability and accessibility of data and information relating to the effectiveness, co-benefits and risks of emerging response options and increasing the efficiency of land use (high confidence). Some response options (e.g., improved soil carbon management) have been implemented only at small-scale demonstration facilities and knowledge, financial, and institutional gaps and challenges exist with upscaling and the widespread deployment of these options (medium confidence). {4.8, 5.5.1, 5.5.2, 5.6.1, 5.6.5, 5.7.5, 6.2, 6.4}

D.2
Near-term action to address climate change adaptation and mitigation, desertification, land degradation and food security can bring social, ecological, economic and development co-benefits (high confidence). Co-benefits can contribute to poverty eradication and more resilient livelihoods for those who are vulnerable (high confidence). {3.4.2, 5.7, 7.5}

D.2.1
Near-term actions to promote sustainable land management will help reduce land and food-related vulnerabilities, and can create more resilient livelihoods, reduce land degradation and desertification, and loss of biodiversity (high confidence). There are synergies between sustainable land management, poverty eradication efforts, access to market, non-market mechanisms and the elimination of low-productivity practices. Maximising these synergies can lead to adaptation, mitigation, and development co-benefits through preserving ecosystem functions and services (medium confidence). {3.4.2, 3.6.3, Table 4.2, 4.7, 4.9, 4.10, 5.6, 5.7, 7.3, 7.4, 7.5, 7.6, Cross-Chapter Box 12 in Chapter 7}

D.2.2
Investments in land restoration can result in global benefits and in drylands can have benefit-cost ratios of between three and six in terms of the estimated economic value of restored ecosystem services (medium confidence). Many sustainable land management technologies and practices are profitable within three to ten years (medium confidence). While they can require upfront investment, actions to ensure sustainable land management can improve crop yields and the economic value of pasture. Land restoration and rehabilitation measures improve livelihood systems and provide both short-term positive economic returns and longer-term benefits in terms of climate change adaptation and mitigation, biodiversity and enhanced ecosystem functions and services (high confidence). {3.6.1, 3.6.3, 4.8.1, 7.2.4, 7.2.3, 7.3.1, 7.4.6, Cross-Chapter Box 10 in Chapter 7}

D.2.3
Upfront investments in sustainable land management practices and technologies can range from about USD20 ha-1 to USD5000 ha-1, with a median estimated to be around USD500 ha-1. Government support and improved access to credit can help overcome barriers to adoption, especially those faced by poor smallholder farmers (high confidence). Near-term change to balanced diets (SPM B6.2.) can reduce the pressure on land and provide significant health co-benefits through improving nutrition (medium confidence). {3.6.3, 4.8, 5.3, 5.5, 5.6, 5.7, 6.4, 7.4.7, 7.5.5, Cross-Chapter Box 9 in Chapter 6}

D.3
Rapid reductions in anthropogenic GHG emissions across all sectors following ambitious mitigation pathways reduce negative impacts of climate change on land ecosystems and food systems (medium confidence). Delaying climate mitigation and adaptation responses across sectors would lead to increasingly negative impacts on land and reduce the prospect of sustainable development (medium confidence). (Box SPM.1, Figure SPM.2) {2.5, 2.7, 5.2, 6.2, 6.4, 7.2, 7.3.1, 7.4.7, 7.4.8, 7.5.6, Cross-Chapter Box 9 in Chapter 6, Cross-Chapter Box 10 in Chapter 7}

D.3.1
Delayed action across sectors leads to an increasing need for widespread deployment of land-based adaptation and mitigation options and can result in a decreasing potential for the array of these options in most regions of the world and limit their current and future effectiveness (high confidence). Acting now may avert or reduce risks and losses, and generate benefits to society (medium confidence). Prompt action on climate mitigation and adaptation aligned with sustainable land management and sustainable development depending on the region could reduce the risk to millions of people from climate extremes, desertification, land degradation and food and livelihood insecurity (high confidence). {1.3.5, 3.4.2, 3.5.2, 4.1.6, 4.7.1, 4.7.2, 5.2.3, 5.3.1, 6.3, 6.5, 7.3.1}

D.3.2
In future scenarios, deferral of GHG emissions reductions implies trade-offs leading to significantly higher costs and risks associated with rising temperatures (medium confidence). The potential for some response options, such as increasing soil organic carbon, decreases as climate change intensifies, as soils have reduced capacity to act as sinks for carbon sequestration at higher temperatures (high confidence). Delays in avoiding or reducing land degradation and promoting positive ecosystem restoration risk long-term impacts including rapid declines in productivity of agriculture and rangelands, permafrost degradation and difficulties in peatland rewetting (medium confidence). {1.3.1, 3.6.2, 4.8, 4.9, 4.9.1, 5.5.2, 6.3, 6.4, 7.2, 7.3; Cross-Chapter Box 10 in Chapter 7}

D.3.3
Deferral of GHG emissions reductions from all sectors implies trade-offs including irreversible loss in land ecosystem functions and services required for food, health, habitable settlements and production, leading to increasingly significant economic impacts on many countries in many regions of the world (high confidence). Delaying action as is assumed in high emissions scenarios could result in some irreversible impacts on some ecosystems, which in the longer-term has the potential to lead to substantial additional GHG emissions from ecosystems that would accelerate global warming (medium confidence). {1.3.1, 2.5.3, 2.7, 3.6.2, 4.9, 4.10.1, 5.4.2.4, 6.3, 6.4, 7.2, 7.3, Cross-Chapter Box 9 in Chapter 6, Cross-Chapter Box 10 in Chapter 7}


+

Acknowledgements

The Special Report on Climate Change and Land broke new ground for IPCC. It was the first IPCC report to be produced by all three Working Groups in collaboration with the Task Force on National Greenhouse Gas Inventories (TFI), and it was the first IPCC report with more authors from developing countries than authors from developed countries. It was marked by an inspiring degree of collaboration and interdisciplinarity, reflecting the wide scope of the mandate given to authors by the Panel. It brought together authors not only from the IPCC’s traditional scientific communities, but also those from sister UN organisations including the Intergovernmental Science-Policy Platform on Biodiversity and Ecosystem Services (IPBES), the Science-Policy Interface of the UN Convention to Combat Desertification (UNCCD) and the Food and Agriculture Organization of the UN (FAO).


We must pay tribute to the 107 Coordinating Lead Authors, Lead Authors and Review Editors, from 52 countries, who were responsible for the report. They gave countless hours of their time, on a voluntary basis, and attended four Lead Author meetings in widely scattered parts of the globe. The constructive interplay between the authors, who draft the report, and the Review Editors, who provide assurance that all comments are responded to, greatly helped the process. Throughout, all demonstrated scientific rigour while at the same time maintaining good humour and a spirit of true collaboration. They did so against a very tight timetable which allowed no scope for slippage. They were supported by input from 96 Contributing Authors.


We would like to acknowledge especially the support of the Chapter Scientists who took time out from their emerging careers to support the production of the report. We thank Yuping Bai, Aliyu Barau, Erik Contreras, Abdoul Aziz Diouf, Baldur Janz, Frances Manning, Dorothy Nampanzira, Chuck Chuan Ng, Helen Paulos, Xiyan Xu and Thobekile Zikhali. We very much hope that the experience will help them in their future careers and that their vital role will be suitably recognised.


The production of the report was guided by a Steering Committee drawn from across the IPCC Bureau. We would like to thank our colleagues who served on this committee including: the Co-Chairs of Working Groups and the TFI: Priyadarshi Shukla, Jim Skea, Valérie Masson-Delmotte, Panmao Zhai, Hans-Otto Pörtner, Debra Roberts, Eduardo Calvo Buendía; Working Group Vice-Chairs: Mark Howden, Nagmeldin Mahmoud, Ramón Pichs-Madruga, Andy Reisinger, Noureddine Yassaa; and Youba Sokona, Vice-Chair of IPCC. Youba Sokona acted as champion for the report and his wise council was valued by all. Further support came from IPCC Bureau members: Edvin Aldrian, Fatima Driouech, Gregory Flato, Jan Fuglestvedt, Muhammad Tariq and Carolina Vera (Working Group I); Andreas Fischlin, Carlos Méndez, Joy Jacqueline Pereira, Roberto A. Sánchez-Rodríguez, Sergey Semenov, Pius Yanda and Taha M. Zatari (Working Group II);  and Amjad Abdulla, Carlo Carraro, Diriba Korecha Dadi and Diana Ürge-Vorsatz (Working Group III).


Several governments and other bodies hosted and supported the scoping meeting, the four Lead Author meetings, and the final IPCC Plenary. These were: the Government of Norway and the Norwegian Environment Agency, the Government of New Zealand and the University of Canterbury, the Government of Ireland and the Environmental Protection Agency, the Government of Colombia and the International Centre for Tropical Agriculture (CIAT), the Government of Switzerland and the World Meteorological Organization.


The staff of the IPCC Secretariat based in Geneva provided a wide range of support for which we would like to thank Abdalah Mokssit, Secretary of the IPCC, and his colleagues: Kerstin Stendahl, Jonathan Lynn, Sophie Schlingemann, Jesbin Baidya, Laura Biagioni, Annie Courtin, Oksana Ekzarkho, Judith Ewa, Joelle Fernandez, Andrea Papucides Bach, Nina Peeva, Mxolisi Shongwe, and Werani Zabula. Thanks are due to Elhousseine Gouaini who served as the conference officer for the 50th Session of the IPCC.

A number of individuals provided support for the visual elements of the report and its communication. We would single out Jordan Harold of the University of East Anglia, Susan Escott of Escott Hunt Ltd, Angela Morelli and Tom Gabriel Johansen of Info Design Lab, and Polly Jackson, Ian Blenkinsop, Autumn Forecast, Francesca Romano and Alice Woodward of Soapbox Communications Ltd.


The report was managed by the Technical Support Unit of IPCC Working Group III which has the generous financial support of the UK Engineering and Physical Sciences Research Council (EPSRC) and the UK Government through its Department of Business, Energy and Industrial Strategy (BEIS). In addition, the Irish Environmental Protection Agency provided support for two secondees to the WG III Technical Support Unit, while the Norwegian Environment Agency enabled an expanded set of communication activities. Without the support of all these bodies this report would not have been possible.


Our particular appreciation goes to the Working Group Technical Support Units whose tireless dedication, professionalism and enthusiasm led the production of this Special Report. This Report could not have been prepared without the commitment of members of the Working Group III Technical Support Unit, all new to the IPCC, who rose to the unprecedented Sixth Assessment Report challenge and were pivotal in all aspects of the preparation of the Report: Raphael Slade, Lizzie Huntley, Katie Kissick, Malek Belkacemi, Renée van Diemen, Marion Ferrat, Eamon Haughey, Bhushan Kankal, Géninha Lisboa, Sigourney Luz, Juliette Malley, Suvadip Neogi, Minal Pathak, Joana Portugal Pereira and Purvi Vyas. Our warmest thanks go to the collegial and collaborative support provided by Sarah Connors, Melissa Gomis, Robin Matthews, Wilfran Moufouma-Okia, Clotilde Péan, Roz Pidcock, Anna Pirani, Tim Waterfield and Baiquan Zhou from the WG I Technical Support Unit, and Jan Petzold, Bard Rama, Maike Nicolai, Elvira Poloczanska, Melinda Tignor and Nora Weyer from the WG II Technical Support Unit.


And a final deep thanks to family and friends who indirectly supported the work by tolerating the periods authors spent away from home, the long hours and their absorption in the process of producing this report.

+

Citation

This Summary for Policymakers should be cited as:

IPCC, 2019: Summary for Policymakers. In: Climate Change and Land: an IPCC special report on climate change, desertification, land degradation, sustainable land management, food security, and greenhouse gas fluxes in terrestrial ecosystems [P.R. Shukla, J. Skea, E. Calvo Buendia, V. Masson-Delmotte, H.- O. Pörtner, D. C. Roberts, P. Zhai, R. Slade, S. Connors, R. van Diemen, M. Ferrat, E. Haughey, S. Luz, S. Neogi, M. Pathak, J. Petzold, J. Portugal Pereira, P. Vyas, E. Huntley, K. Kissick, M. Belkacemi, J. Malley, (eds.)]. In press.

+

SPM in UN Languages

Arabic Download
Chinese Download
French Download
Russian Download
Spanish Download

The assistance of IPCC Bureau Members and Special Report authors who supported the WMO Language, Conference and Publishing Services Department in translating the Special Report on Climate Change and Land SPM is gratefully acknowledged: Noureddine Yassaa (Arabic), Panmao Zhai (Chinese), Jianguo Wu (Chinese), Valérie Masson-Delmotte (French), Nathalie de Noblet-Ducoudré (French), Ramón Pichs-Madruga (Spanish), Sergey Semenov (Russian), Andrey Sirin (Russian)

Footnotes

  1. The terrestrial portion of the biosphere that comprises the natural resources (soil, near-surface air, vegetation and other biota, and water), the ecological processes, topography, and human settlements and infrastructure that operate within that system.  
  2. The three Special reports are: Global Warming of 1.5°C: an IPCC special report on the impacts of global warming of 1.5°C above pre-industrial levels and related global greenhouse gas emission pathways, in the context of strengthening the global response to the threat of climate change, sustainable development, and efforts to eradicate poverty; Climate Change and Land: an IPCC special report on climate change, desertification, land degradation, sustainable land management, food security, and greenhouse gas fluxes in terrestrial ecosystems; The Ocean and Cryosphere in a Changing Climate.  
  3. Related proposals were: climate change and desertification; desertification with regional aspects; land degradation – an assessment of the interlinkages and integrated strategies for mitigation and adaptation; agriculture, forestry and other land use; food and agriculture; and food security and climate change.  
  4. Sustainable land management is defined in this report as ‘the stewardship and use of land resources, including soils, water, animals and plants, to meet changing human needs, while simultaneously ensuring the long-term productive potential of these resources and the maintenance of their environmental functions’.  
  5. Desertification is defined in this report as ‘land degradation in arid, semi-arid, and dry sub-humid areas resulting from many factors, including climatic variations and human activities’.  
  6. Land degradation is defined in this report as ‘a negative trend in land condition, caused by direct or indirect human induced processes, including anthropogenic climate change, expressed as long-term reduction and as loss of at least one of the following: biological productivity; ecological integrity; or value to humans’.  
  7. Food security is defined in this report as ‘a situation that exists when all people, at all times, have physical, social, and economic access to sufficient, safe and nutritious food that meets their dietary needs and food preferences for an active and healthy life’.  
  8. The assessment covers literature accepted for publication by 7th April 2019.  
  9. Each finding is grounded in an evaluation of underlying evidence and agreement. A level of confidence is expressed using five qualifiers: very low, low, medium, high and very high, and typeset in italics, for example, medium confidence. The following terms have been used to indicate the assessed likelihood of an outcome or a result: virtually certain 99–100% probability, very likely 90–100%, likely 66–100%, about as likely as not 33–66%, unlikely 0–33%, very unlikely 0–10%, exceptionally unlikely 0–1%. Additional terms (extremely likely 95–100%, more likely than not >50–100%, more unlikely than likely 0–<50%, extremely unlikely 0–5%) may also be used when appropriate. Assessed likelihood is typeset in italics, for example, very likely. This is consistent with IPCC AR5.  
  10. Land’s potential net primary production (NPP) is defined in this report as ‘the amount of carbon accumulated through photosynthesis minus the amount lost by plant respiration over a specified time period that would prevail in the absence of land use’.  
  11. In its conceptual framework, IPBES uses ‘nature’s contribution to people’ in which it includes ecosystem goods and services.  
  12. e., estimated at $75 trillion for 2011, based on US dollars for 2007.  
  13. This statement is based on the most comprehensive data from national statistics available within FAOSTAT, which starts in 1961. This does not imply that the changes started in 1961. Land use changes have been taking place from well before the pre-industrial period to the present.  
  14. A heatwave is defined in this report as ‘a period of abnormally hot weather’. Heatwaves and warm spells have various and, in some cases, overlapping definitions.  
  15. The interpretation of satellite observations can be affected by insufficient ground validation and sensor calibration. In addition their spatial resolution can make it difficult to resolve small-scale changes.  
  16. Vegetation greening is defined in this report as ‘an increase in photosynthetically active plant biomass which is inferred from satellite observations’.  
  17. CO2 fertilisation is defined in this report as ‘the enhancement of plant growth as a result of increased atmospheric carbon dioxide (CO2) concentration’. The magnitude of CO2 fertilisation depends on nutrients and water availability.  
  18. Vegetation browning is defined in this report as ‘a decrease in photosynthetically active plant biomass which is inferred from satellite observations’.  
  19. Evidence relative to such trends in dust storms and health impacts in other regions is limited in the literature assessed in this report.  
  20. The assessment covered literature whose methodologies included interviews and surveys with indigenous peoples and local communities.  
  21. This assessment only includes CO2, CH4 and N2  
  22. Global food system in this report is defined as ‘all the elements (environment, people, inputs, processes, infrastructures, institutions, etc.) and activities that relate to the production, processing, distribution, preparation and consumption of food, and the output of these activities, including socioeconomic and environmental outcomes at the global level’. These emissions data are not directly comparable to the national inventories prepared according to the 2006 IPCC Guidelines for National Greenhouse Gas Inventories.  
  23. The net anthropogenic flux of CO2 from ‘bookkeeping’ or ‘carbon accounting’ models is composed of two opposing gross fluxes: gross emissions (about 20 GtCO2 yr-1) are from deforestation, cultivation of soils, and oxidation of wood products; gross removals (about 14 GtCO2 yr-1) are largely from forest growth following wood harvest and agricultural abandonment (medium confidence).  
  24. This assessment only includes CO2, CH4 and N2  
  25. Land conditions encompass changes in land cover (e.g., deforestation, afforestation, urbanisation), in land use (e.g., irrigation), and in land state (e.g., degree of wetness, degree of greening, amount of snow, amount of permafrost).  
  26. Land with high albedo reflects more incoming solar radiation than land with low albedo.  
  27. The literature indicates that forest cover changes can also affect climate through changes in emissions of reactive gases and aerosols. {2.4, 2.5}  
  28. Emerging literature shows that boreal forest-related aerosols may counteract at least partly the warming effect of surface albedo. {2.4.3}  
  29. Unprecedented climatic conditions are defined in this report as ‘not having occurred anywhere during the 20th century’. They are characterised by high temperature with strong seasonality and shifts in precipitation. In the literature assessed, the effect of climatic variables other than temperature and precipitation were not considered.  
  30. The supply of food is defined in this report as ‘encompassing availability and access (including price)’. Food supply instability refers to variability that influences food security through reducing access.  
  31. West Africa has a high number of people vulnerable to increased desertification and yield decline. North Africa is vulnerable to water scarcity.  
  32. The land systems considered in this report do not include urban ecosystem dynamics in detail. Urban areas, urban expansion, and other urban processes and their relation to land-related processes are extensive, dynamic, and complex. Several issues addressed in this report such as population, growth, incomes, food production and consumption, food security, and diets have close relationships with these urban processes. Urban areas are also the setting of many processes related to land-use change dynamics, including loss of ecosystem functions and services, that can lead to increased disaster risk. Some specific urban issues are assessed in this report.  
  33. Sustainable land management is defined in this report as ‘the stewardship and use of land resources, including soils, water, animals and plants, to meet changing human needs, while simultaneously ensuring the long-term productive potential of these resources and the maintenance of their environmental functions’. Examples of options include, inter alia, agroecology (including agroforestry), conservation agriculture and forestry practices, crop and forest species diversity, appropriate crop and forest rotations, organic farming, integrated pest management, the conservation of pollinators, rain water harvesting, range and pasture management, and precision agriculture systems.  
  34. Sustainable forest management is defined in this report as ‘the stewardship and use of forests and forest lands in a way, and at a rate, that maintains their biodiversity, productivity, regeneration capacity, vitality, and their potential to fulfil now and in the future, relevant ecological, economic and social functions at local, national and global levels and that does not cause damage to other ecosystems’.  
  35. In this report references to pathways limiting global warming to a particular level are based on a 66% probability of staying below that temperature level in 2100 using the MAGICC model.  
  36. Representative Concentration Pathways (RCPs) are scenarios that include timeseries of emissions and concentrations of the full suite of greenhouse gases (GHGs) and aerosols and chemically active gases, as well as land use/land cover.  
  37. Integrated Assessment Models (IAMs) integrate knowledge from two or more domains into a single framework. In this figure, IAMs are used to assess linkages between economic, social and technological development and the evolution of the climate system.  
  38. The RCP1.9 pathways assessed in this report have a 66% chance of limiting warming to 1.5°C in 2100, but some of these pathways overshoot 1.5°C of warming during the 21st century by >0.1°C.    

Technical Summary