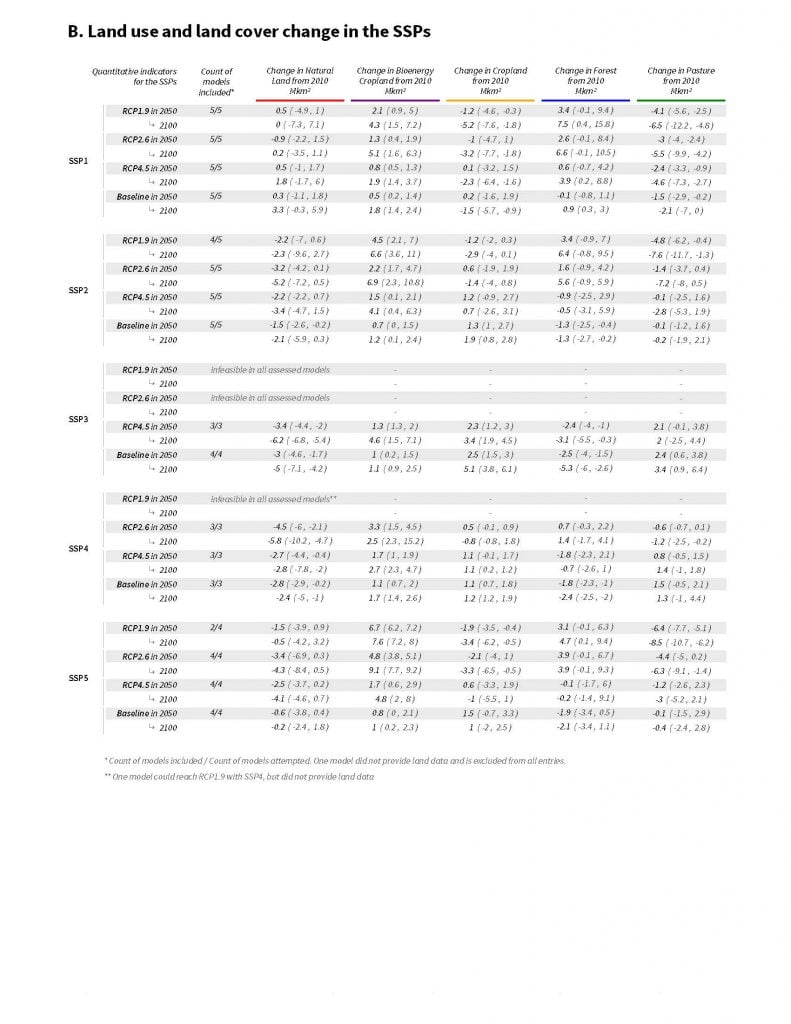
Figure SPM.4B
Future scenarios provide a framework for understanding the implications of mitigation and socioeconomics on land. The Shared Socioeconomic Pathways (SSPs) span a range of different socioeconomic assumptions (Box SPM.1). They are combined with Representative Concentration Pathways (RCPs) which imply different levels of mitigation. The changes in cropland, pasture, bioenergy cropland, forest, and natural land from 2010 are shown. For this Figure, Cropland includes all land in food, feed, and fodder crops, as well as other arable land (cultivated area). This category includes first generation non-forest bioenergy crops (e.g., corn for ethanol, sugar cane for ethanol, soybeans for biodiesel), but excludes second generation bioenergy crops. Pasture includes categories of pasture land, not only high-quality rangeland, and is based on FAO definition of ‘permanent meadows and pastures’. Bioenergy cropland includes land dedicated to second generation energy crops (e.g., switchgrass, miscanthus, fast-growing wood species). Forest includes managed and unmanaged forest. Natural land includes other grassland, savannah, and shrubland. Panel A: This panel shows integrated assessment model (IAM) results for SSP1, SSP2 and SSP5 at RCP1.9. For each pathway, the shaded areas show the range across all IAMs; the line indicates the median across models. For RCP1.9, SSP1, SSP2 and SSP5 results are from five, four and two IAMs respectively. Panel B: Land use and land cover change are indicated for various SSP-RCP combinations, showing multi-model median and range (min, max). (Box SPM.1) {1.3.2, 2.7.2, 6.1, 6.4.4, 7.4.2, 7.4.4, 7.4.5, 7.4.6, 7.4.7, 7.4.8, 7.5.3, 7.5.6, Cross-Chapter Box 1 in Chapter 1, Cross-Chapter Box 9 in Chapter 6}