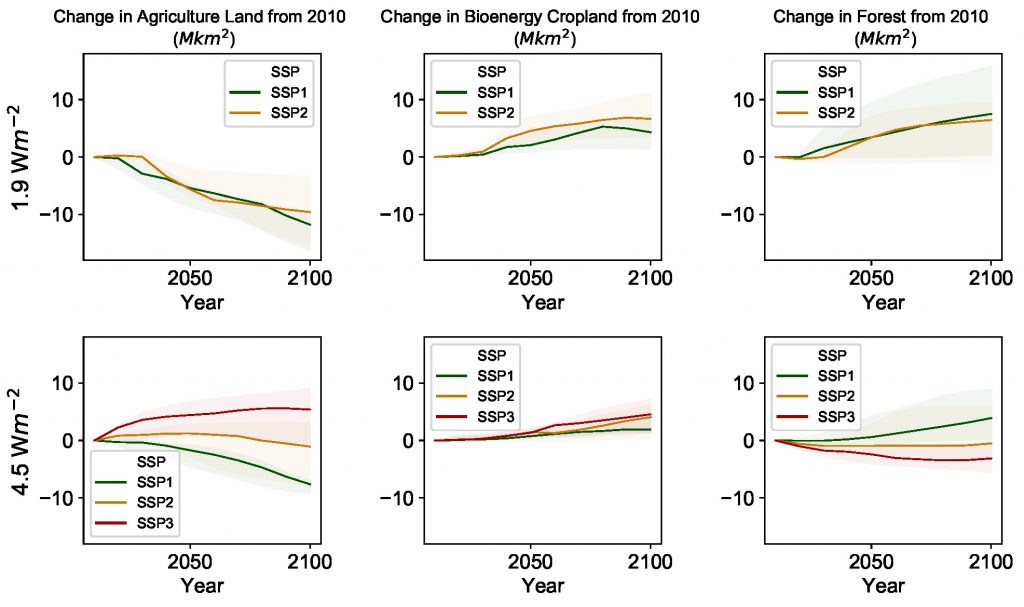
Changes in agriculture land (left), bioenergy cropland (middle) and forest (right) under three different SSPs (colours) and two different warming levels (rows). Agricultural land includes both pasture and cropland. Colours indicate SSPs, with SSP1 shown in green, SSP2 in yellow, and SSP3 in red. For each pathway, the shaded areas show the range across all IAMs; the line indicates the median across models. There is no SSP3 in the top row, as 1.9 W m–2 is infeasible in this world. Data is from an update of the Integrated Assessment Modelling Consortium (IAMC) Scenario Explorer developed for the SR15 (Huppmann et al. 2018; Rogelj et al. 2018a).