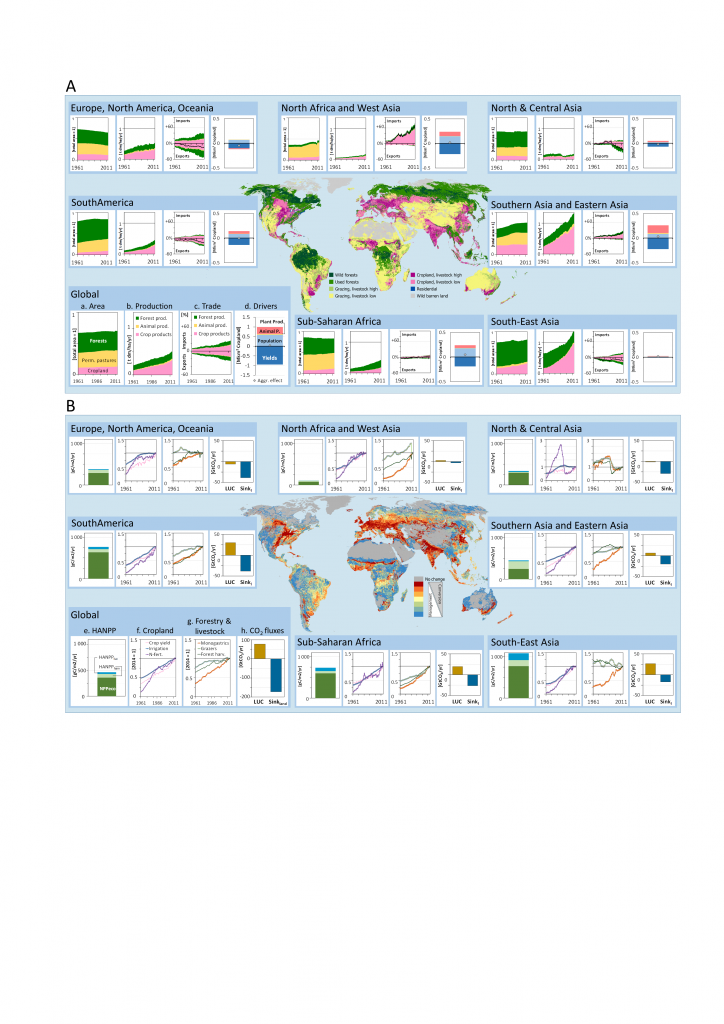
Figure 1.3
Status and trends in the global land system: A. Trends in area, production and trade, and drivers of change. The map shows the global pattern of land systems (combination of maps Nachtergaele (2008); Ellis et al. (2010); Potapov et al. (2017); FAO’s Animal Production and Health Division (2018); livestock low/high relates to low or high livestock density, respectively). The inlay figures show, for the globe and seven world regions, from left to right: (a) Cropland, permanent pastures and forest (used and unused) areas, standardised to total land area, (b) production in dry matter per year per total land area, (c) trade in dry matter in percent of total domestic production, all for 1961 to 2014 (data from FAOSTAT (2018) and FAO (1963) for forest area 1961). (d) drivers of cropland for food production between 1994 and 2011 (Alexander et al. 2015). See panel “global” for legend. “Plant Produc., Animal P.”: changes in consumption of plant-based products and animal-products, respectively. B.Selected land-use pressures and impacts. The map shows the ratio between impacts on biomass stocks of land-cover conversions and of land management (changes that occur with land-cover types; only changes larger than 30 gC m–2 displayed; Erb et al. 2017), compared to the biomass stocks of the potential vegetation (vegetation that would prevail in the absence of land use, but with current climate). The inlay figures show, from left to right (e) the global Human Appropriation of Net Primary production (HANPP) in the year 2005, in gC m–2 yr–1 (Krausmann et al. 2013). The sum of the three components represents the NPP of the potential vegetation and consist of: (i) NPPeco, i.e. the amount of NPP remaining in ecosystem after harvest, (ii) HANPPharv, i.e. NPP harvested or killed during harvest, and (iii) HANPPluc, i.e. NPP foregone due to land-use change. The sum of NPPeco and HANPPharv is the NPP of the actual vegetation (Haberl et al. 2014; Krausmann et al. 2013). The two central inlay figures show changes in land-use intensity, standardised to 2014, related to (f) cropland (yields, fertilisation, irrigated area) and (g) forestry harvest per forest area, and grazers and monogastric livestock density per agricultural area (FAOSTAT 2018). (h) Cumulative CO2 fluxes between land and the atmosphere between 2000 and 2014. LUC: annual CO2 land use flux due to changes in land cover and forest management; Sinkland: the annual CO2 land sink caused mainly by the indirect anthropogenic effects of environmental change (e.g, climate change and the fertilising effects of rising CO2 and N concentrations), excluding impacts of land-use change (Le Quéré et al. 2018) (Section 2.3)