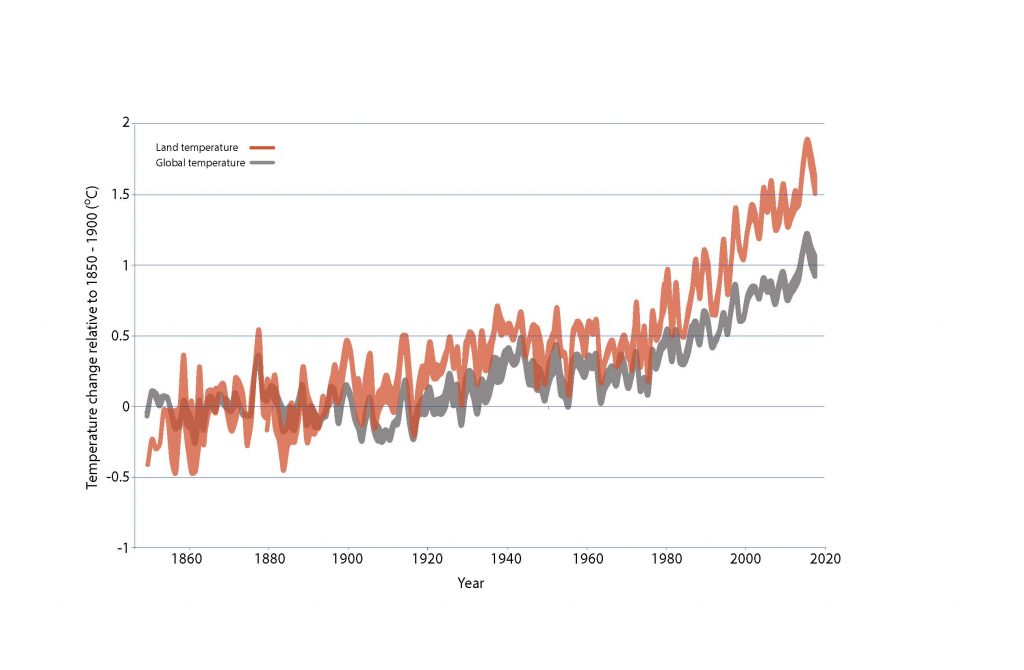
Evolution of land surface air temperature (LSAT) and global mean surface temperature (GMST) over the period of instrumental observations. The brown line shows annual mean LSAT in the BEST, CRUTEM4.6, GHCNmv4 and GISTEMP datasets, expressed as departures from global average LSAT in 1850–1900, with the brown line thickness indicating inter-dataset range. The blue line shows annual mean GMST in the HadCRUT4, NOAAGlobal Temp, GISTEMP and Cowtan&Way datasets (monthly values of which were reported in the Special Report on Global Warming of 1.5ºC; Allen et al. 2018).