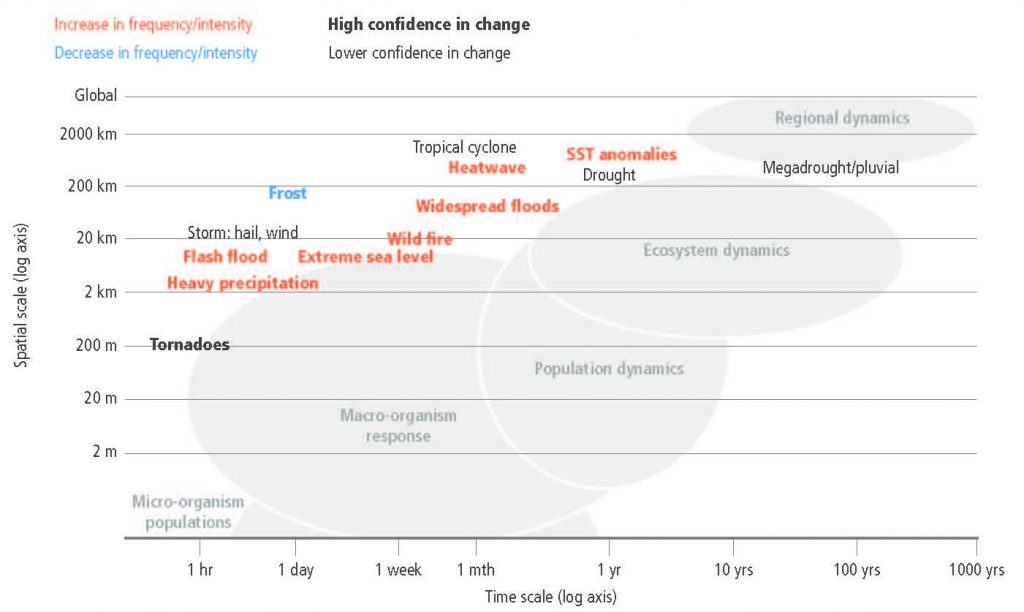
Spatial and temporal scales of typical extreme weather and climate events and the biological systems they impact (shaded grey).Individuals, populations and ecosystems within these space-time ranges respond to relevant climate stressors. Orange (blue) labels indicate an increase (decrease) in the frequency or intensity of the event, with bold font reflecting confidence in the change. Non-bold black labels indicate low confidence in observed changes in frequency or intensity of these events. Each event type indicated in the figure is likely to affect biological systems at all temporal and spatial scales located to the left and below the specific event position in the figure. From Ummenhofer and Meehl (2017).