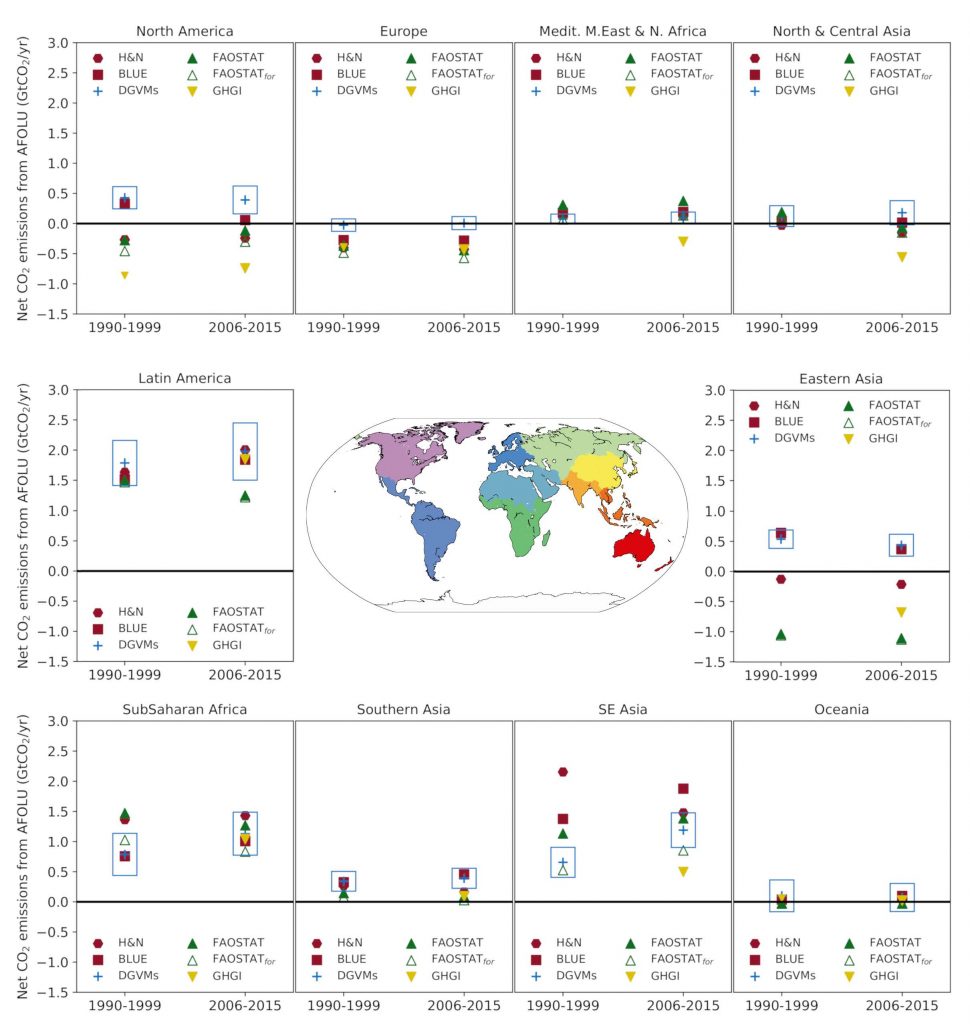
Regional trends in net anthropogenic land-atmosphere CO2 flux from a range of different approaches (in GtCO2 yr–1).Red symbols: bookkeeping models (hexagon: Houghton and Nassikas 2017; square: Hansis et al. 2015). Blue cross: the mean from DGMVs with the box showing the 1 standard deviation range. Green triangles: downloaded from FAOSTAT website; the open triangle is primarily forest-related emissions, while the closed triangle includes emission from peat fires and peat drainage. Yellow inverted triangle: GHGI LULUCF flux based on country reports to UNFCCC (Grassi et al. 2018). Data for developing countries are only shown for 2006–2015 because reporting in many developing countries became more consistent/reliable after 2005. For more details on methods see Box 2.2.