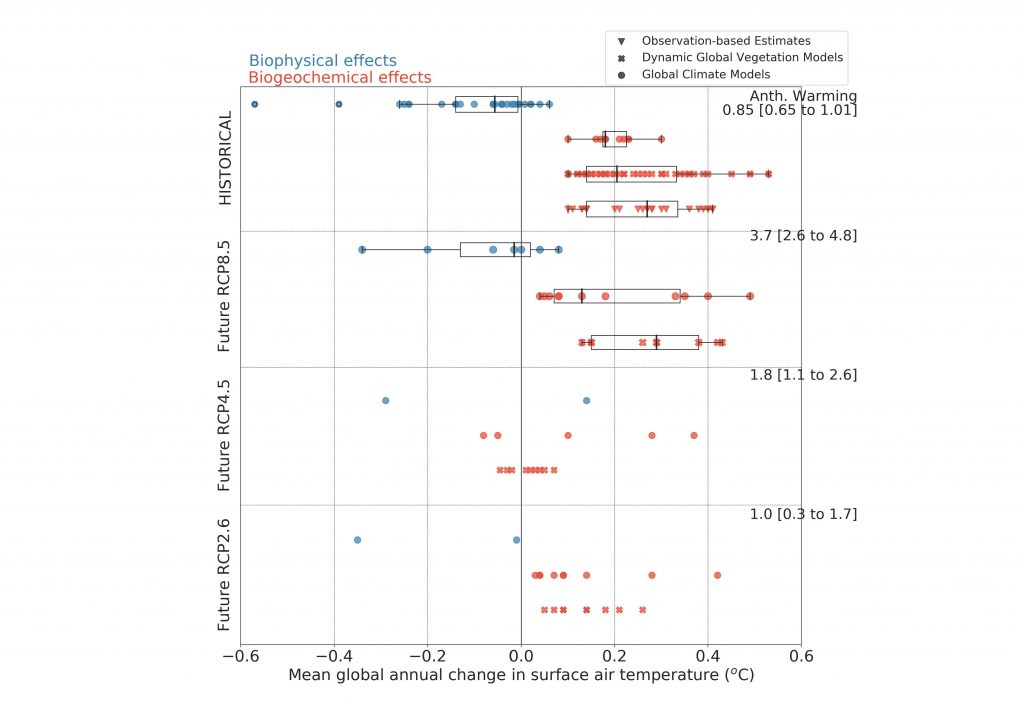
Figure 2.14
Changes in mean global annual surface air temperature (ºC) in response to historical and future anthropogenic land cover changes as estimated from a range of studies. See Table A2.1 in the Appendix for detailed information. Temperature changes resulting from biophysical processes (e.g., changes in physical land surface characteristics such as albedo, evapotranspiration and roughness length) are illustrated using blue symbols and temperature changes resulting from biogeochemical processes (e.g., changes in atmospheric CO2 composition) use red symbols. Future changes are shown for three distinct scenarios: RCP8.5, RCP4.5 and RCP2.6. The markers ‘filled circle’, ‘filled cross’ and ‘filled triangle down’ represent estimates from global climate models, DGVMs and observations respectively. When the number of estimates is sufficiently large, box plots are overlaid; they show the ensemble minimum, first quartile (25th percentile), median, third quartile (75th percentile), and the ensemble maximum. Scatter points beyond the box plot are the outliers. Details about how temperature change is estimated from DGVMs and observations is provided in the Appendix. Numbers on the right-hand side give the mean and the range of simulated mean global annual warming from various climate models