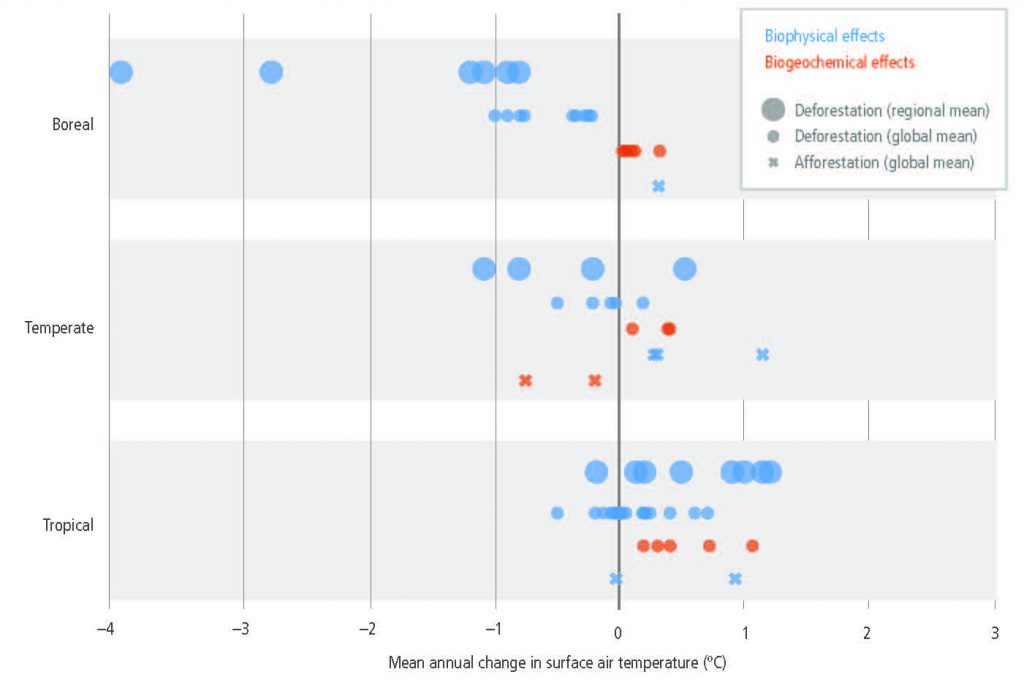
Changes in mean annual surface air temperature (ºC) in response to idealised large-scale deforestation (circles) or forestation (crosses).Estimated from a range of studies (see Table A2.2 in the Appendix for detailed information and references to the studies). Temperature changes resulting from biophysical processes (e.g., changes in physical land surface characteristics such as albedo, evapotranspiration, and roughness length) are illustrated using blue symbols and temperature changes resulting from biogeochemical processes (e.g., changes in atmospheric CO2 composition) use orange symbols. Small blue and orange circles and crosses are model-based estimates of changes in temperature averaged globally. Large circles are estimates averaged only over the latitudinal band where deforestation is imposed.