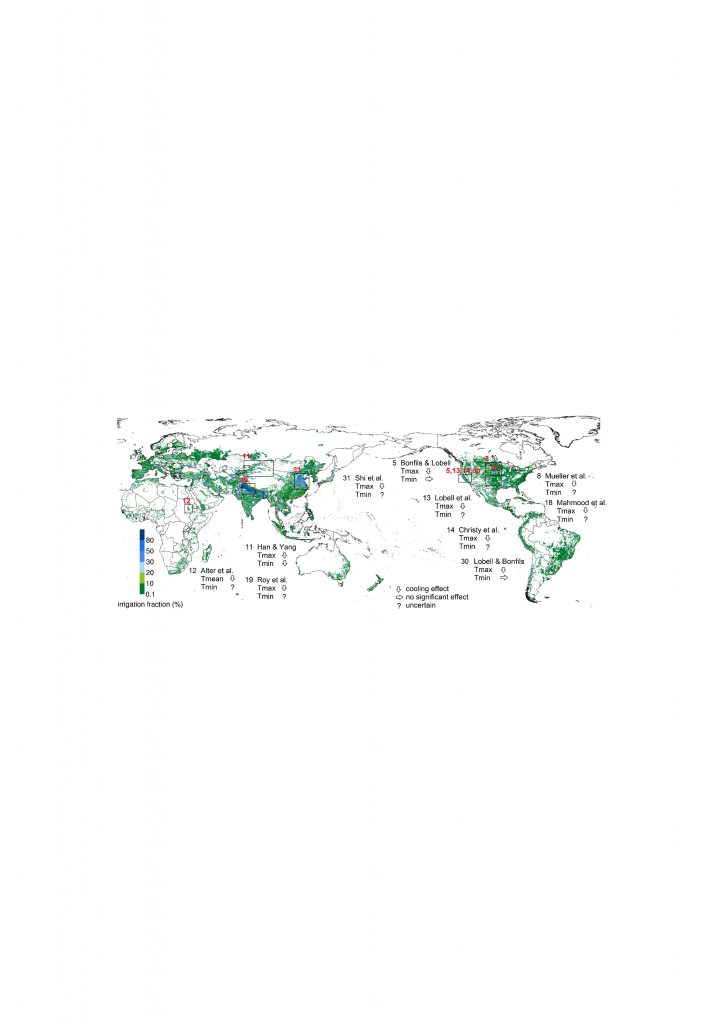
Global map of areas equipped for irrigation (colours), expressed as a percentage of total area, or irrigation fraction. Source: Siebert et al. (2013). Numbered boxes show regions where irrigation causes cooling (down arrow) of surface mean (Tmean), maximum (Tmax) or minimum (Tmin) temperature, or else no significant effect (right arrow) or where the effect is uncertain (question mark), based on observational studies as reviewed in Chen and Jeong (2018). Tmax refers to the warmest daily temperature while Tmin to the coldest one, which generally occurs at night (Alter et al. 2015; Han and Yang 2013; Roy et al. 2007; Shi et al. 2013; Bonfils and Lobell 2007; Lobell et al. 2008; Lobell and Bonfils 2008; Christy et al. 2006; Mahmood et al. 2006; Mueller et al. 2015).