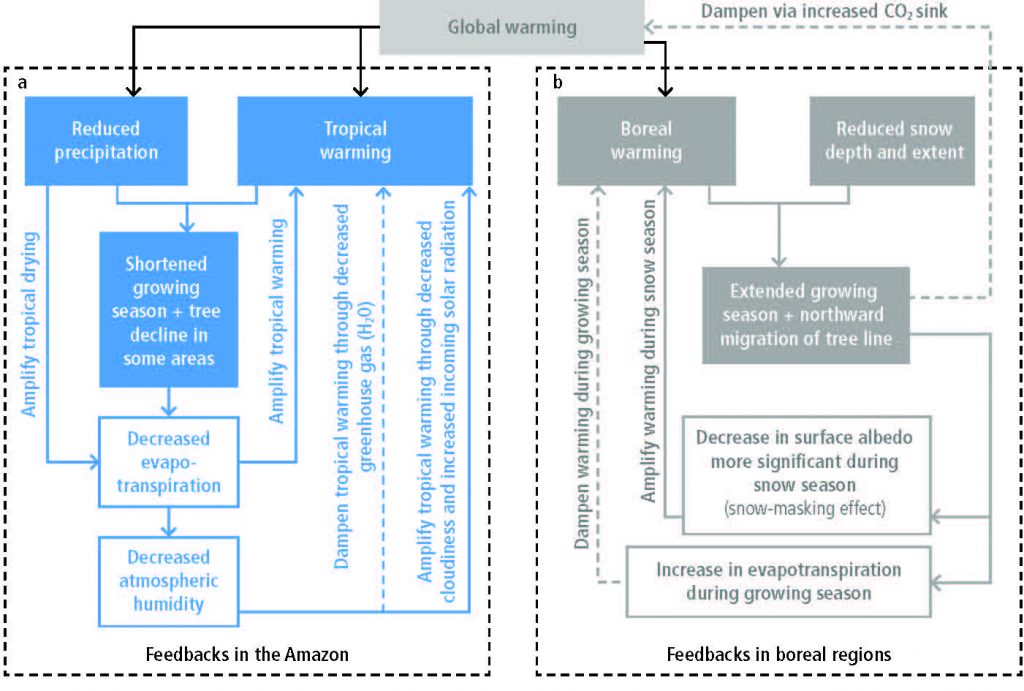
Schematic illustration of the processes through which the effects of global warming in (a) the Amazon (blue arrows and boxes), and (b) boreal regions (grey arrows and boxes) feedback on the regional climate change. In boreal regions, the sign of the feedbacks depends on the season, although annually global warming is further enhanced in those regions. Dashed lines illustrate negative feedbacks, while solid lines indicate positive feedbacks. References supporting this figure can be found in the text.