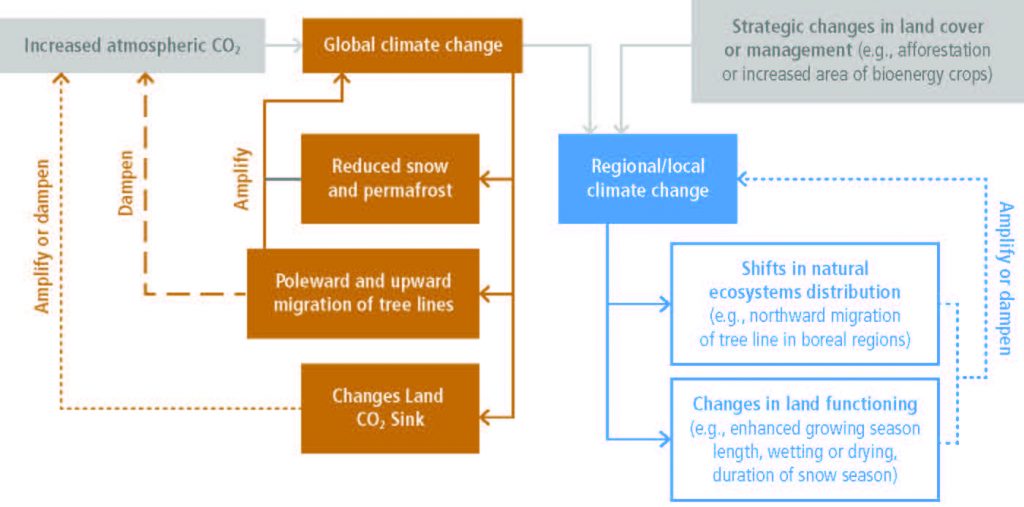
Figure 2.20
Schematics of the various ways land has been shown in the literature to either amplify or dampen the initial GHG-induced climatic change. Brown arrows and boxes represent the global scale and blue arrows and boxes represent the regional/local level. Grey arrows and boxes refer to what we consider herein as imposed changes – that is, the initial atmospheric GHG content as well as anthropogenic land cover change and land management. Dampening feedbacks are represented with dashed lines, amplifying ones with solid lines and feedbacks where the direction may be variable are represented using dotted lines. The feedbacks initiated by changes in snow and permafrost areas in boreal regions are discussed in Section 2.5.3.2, the ones initiated by changes in ecosystem distribution are discussed in Sections 2.5.3.1, 2.5.1 and 2.5.2, and the feedbacks related to changes in the land functioning are discussed in Sections 2.5.3.3 and 2.5.1, as well as in Sections 2.3and 2.5 (for changes in net CO2 fluxes). References supporting this figure can be found in each of those sections.