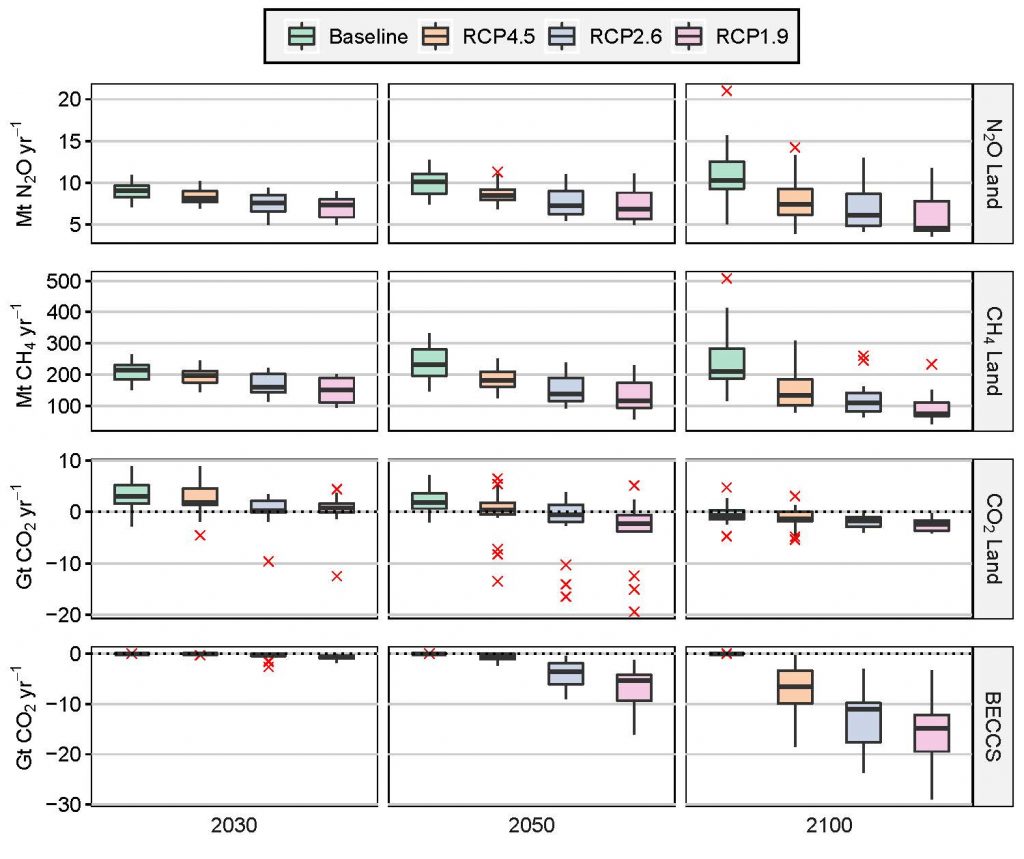
Figure 2.25
Land-based global GHG emissions and removals in 2030, 2050 and 2100 for baseline, RCP4.5, RCP2.6 and RCP1.9 based on the SSP. Source: Popp et al. (2017), Rogelj et al. (2018), Riahi et al. (2017). Data is from an update of the IAMC Scenario Explorer developed for the SR15 (Huppmann et al. 2018; Rogelj et al. 2018). Boxplots (Tukey style) show median (horizontal line), interquartile range (IQR box) and the range of values within 1.5 × IQR at either end of the box (vertical lines) across 5 SSPs and across 5 IAMs. Outliers (red crosses) are values greater than 1.5 × IQR at either end of the box. The categories CO2 Land, CH4 Land and N2O Land include GHG emissions from land-use change and agricultural land use (including emissions related to bioenergy production). In addition, the category CO2 Land includes negative emissions due to afforestation. BECCS reflects the CO2 emissions captured from bioenergy use and stored in geological deposits.