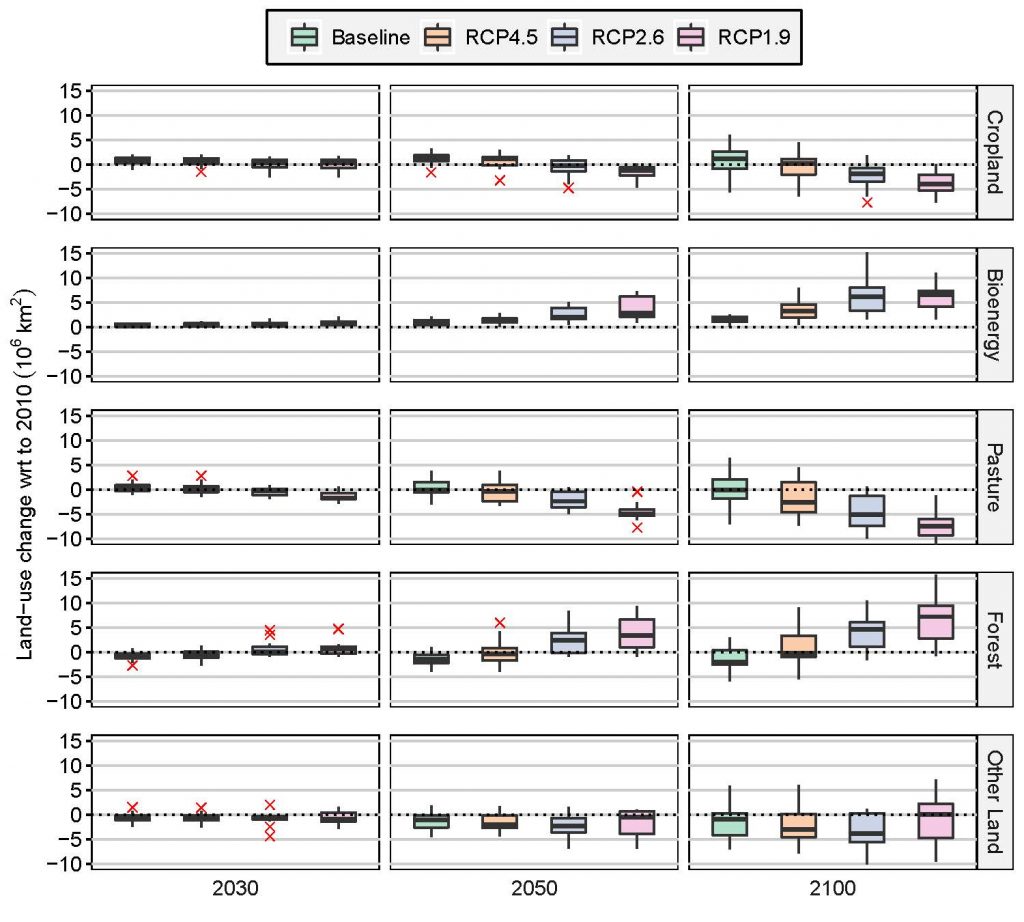
Global change of major land cover types by 2030, 2050 and 2100 relative to 2010 for baseline, RCP4.5, RCP2.6 and RCP1.9 based on the SSP. Source: Popp et al. (2017), Rogelj et al. (2018), Riahi et al. (2017). Data is from an update of the IAMC Scenario Explorer developed for the SR15 (Huppmann et al. 2018; Rogelj et al. 2018). Boxplots (Tukey style) show median (horizontal line), interquartile range IQR (box) and the range of values within 1.5 × IQR at either end of the box (vertical lines) across 5 SSPs and across 5 IAMs. Outliers (red crosses) are values greater than 1.5 × IQR at either end of the box. In 2010, total land cover at global scale was estimated 15–16 Mkm2 for cropland, 0–0.14 Mkm2 for bioenergy, 30–35 Mkm2 for pasture and 37–42 Mkm2 for forest, across the IAMs that reported SSP pathways (Popp et al. 2017).