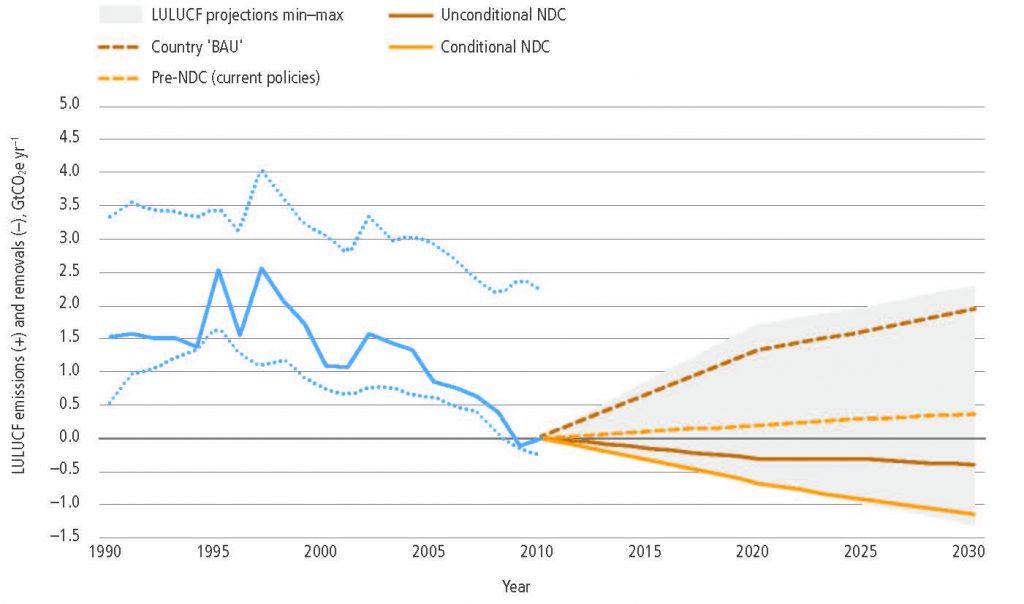
Figure 2.28
Global LULUCF net GHG flux for the historical period and future scenarios based on analyses of countries’ NDCs.The LULUCF historical data (blue solid line) reflect the following countries’ documents (in order of priority): (i) data submitted to UNFCCC (NDCs, 2015 GHG Inventories and recent National Communications ), (ii) other official countries’ documents, (iii) FAO-based datasets (i.e., FAO-FRA for forest (Tian et al. 2015)) as elaborated by (Federici et al. 2015), and (iv) FAOSTAT for non-forest land use emissions (FAO 2015). The four future scenarios reflect official countries’ information, mostly intended NDCs or updated NDCs available at the time of the analysis (Feb 2016), complemented by Biennial Update Reports and National Communications, and show (i) the BAU scenario as defined by the country, (ii) the trend based on pre-NDC levels of activity (current policies in place in countries), and (iii) the unconditional NDC and conditional NDC scenarios. The shaded area indicates the full range of countries’ available projections (min-max), expressing the available countries’ information on uncertainties beyond the specific scenarios shown. The range of historical country datasets (dotted lines) reflects differences between alternative selections of country sources, in essence, GHG inventories for developed countries complemented by FAO-based datasets (upper range) or by data in National Communications (lower range) for developing countries.