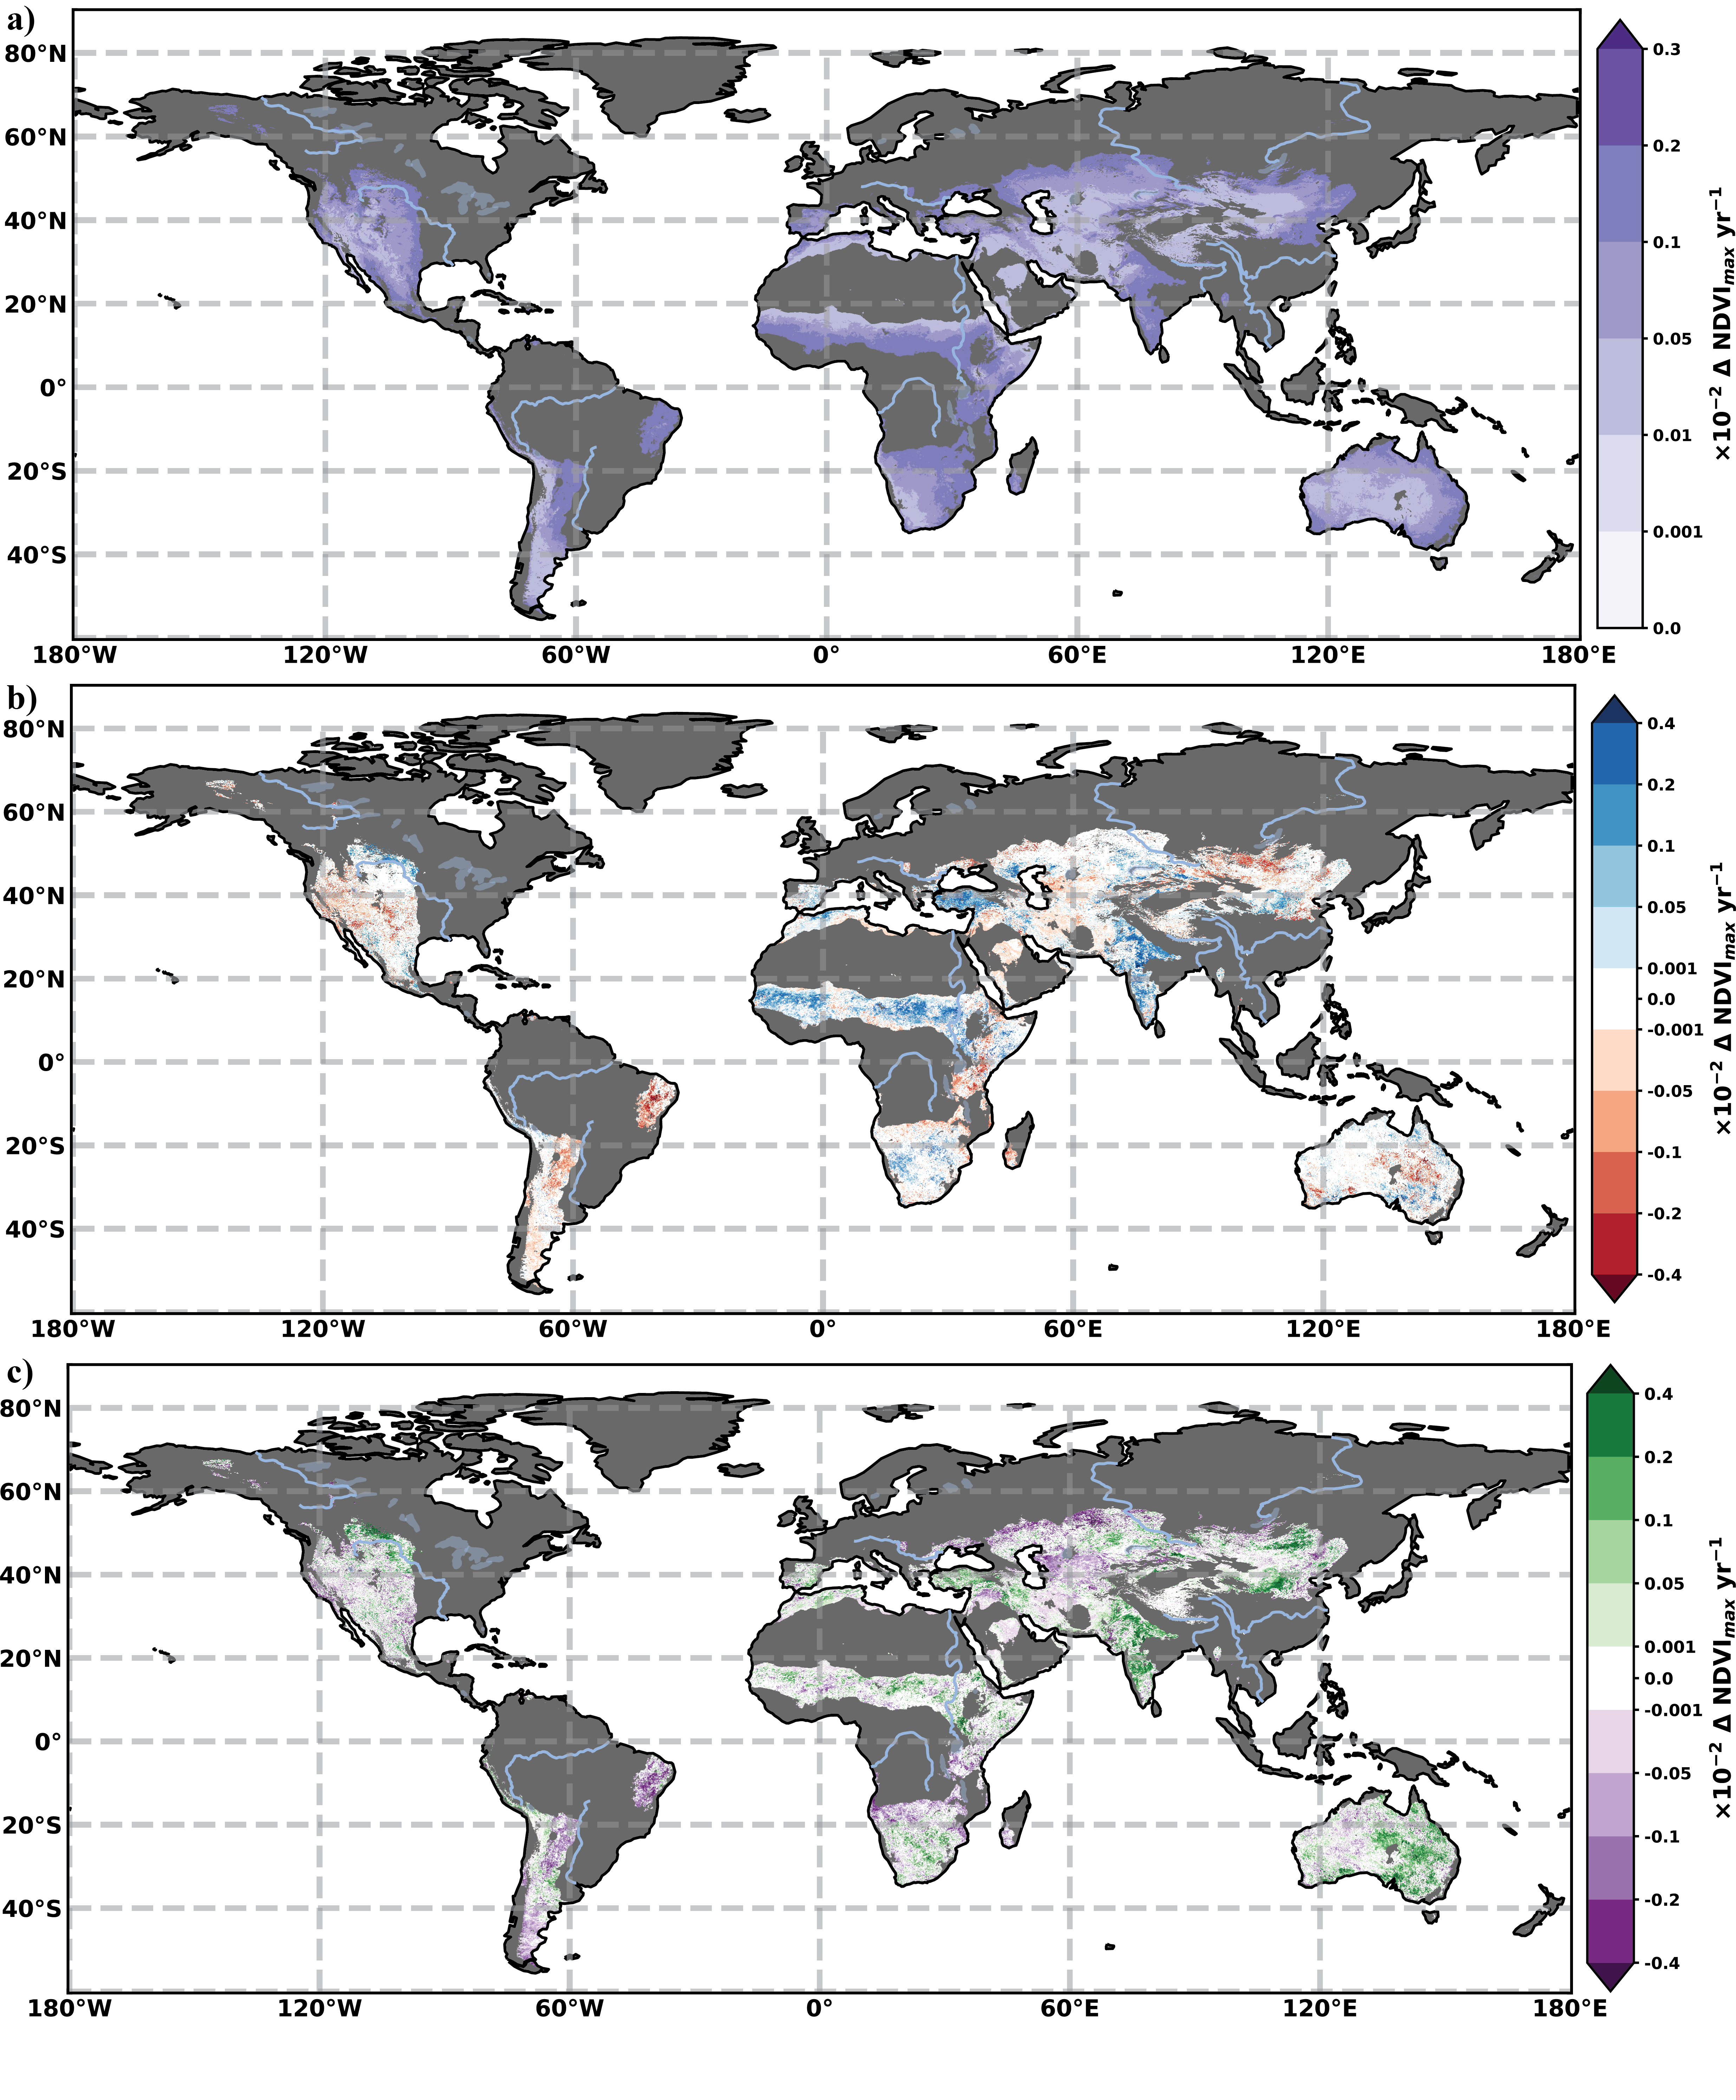
The drivers of dryland vegetation change. The mean annual change in NDVImax between 1982 and 2015 (see Figure 3.6 for total change using Global Inventory Modelling and Mapping Studies NDVI3g v1 dataset) attributable to(a)CO2 fertilisation(b)climate and (c) land use. The change attributable to CO2 fertilisation was calculated using the CO2 fertilisation relationship described in Franks et al. 2013. The Time Series Segmented Residual Trends (TSS-RESTREND) method (Burrell et al. 2017) applied to the CO2-adjusted NDVI was used to separate Climate and Land Use. A multi-climate dataset ensemble was used to reduce the impact of dataset errors (Burrell et al. 2018). Non-dryland regions (aridity index >0.65) are masked in dark grey. Areas where the change did not meet the multi-run ensemble significance criteria, or are smaller than the error in the sensors (±0.00001) are masked in white